Matt Lentzner, Janine Jagger and I have designed a survey for participants of Gluten-free January, using the online application StatCrunch. Janine is an epidemiologist who studies healthcare worker safety at the University of Virginia; she has experience designing surveys for data collection so we're glad to have her on board. The survey will allow us to systematically gather and analyze data on the results of Gluten-free January. It will be 100 percent anonymous-- none of your answers will be connected to your identity in any way.
This survey has the potential to be really informative, but it will only work if you respond! The more people who take the survey, the more informative it will be, even if you didn't avoid gluten for a single day. If not very many people respond, it will be highly susceptible to "selection bias", where perhaps the only people who responded are people who improved the most, skewing the results.
Matt will be sending the survey out to everyone on his mailing list. Please complete it, even if you didn't end up avoiding gluten at all! There's no shame in it. The survey has responses built in for people who didn't avoid gluten. Your survey will still be useful!
We have potential data from over 500 people. After we crunch the numbers, I'll share them on the blog.
Monday, January 31, 2011
Thursday, January 27, 2011
Two Wheat Challenge Ideas from Commenters
Some people have remarked that the blinded challenge method I posted is cumbersome.
Reader "Me" suggested:
Reader "Me" suggested:
You can buy wheat gluten in a grocery store. Why not simply have your friend add some wheat gluten to your normal protein shake.Reader David suggested:
They sell empty gelatin capsules with carob content to opacify them. Why not fill a few capsules with whole wheat flour, and then a whole bunch with rice starch or other placebo. For two weeks take a set of, say, three capsules every day, with the set of wheat capsules in line to be taken on a random day selected by your friend. This would further reduce the chances that you would see through the blind, and it prevent the risk of not being able to choke the "smoothie" down. It would also keep it to wheat and nothing but wheat (except for the placebo starch).The reason I chose the method in the last post is that it directly tests wheat in a form that a person would be likely to eat: bread. The limitation of the gluten shake method is that it would miss a sensitivity to components in wheat other than gluten. The limitation of the pill method is that raw flour is difficult to digest, so it would be difficult to extrapolate a sensitivity to cooked flour foods. You might be able to get around that by filling the pills with powdered bread crumbs. Those are two alternative ideas to consider if the one I posted seems too involved.
Monday, January 24, 2011
Blinded Wheat Challenge
Self-experimentation can be an effective way to improve one's health*. One of the problems with diet self-experimentation is that it's difficult to know which changes are the direct result of eating a food, and which are the result of preconceived ideas about a food. For example, are you more likely to notice the fact that you're grumpy after drinking milk if you think milk makes people grumpy? Maybe you're grumpy every other day regardless of diet? Placebo effects and conscious/unconscious bias can lead us to erroneous conclusions.
The beauty of the scientific method is that it offers us effective tools to minimize this kind of bias. This is probably its main advantage over more subjective forms of inquiry**. One of the most effective tools in the scientific method's toolbox is a control. This is a measurement that's used to establish a baseline for comparison with the intervention, which is what you're interested in. Without a control measurement, the intervention measurement is typically meaningless. For example, if we give 100 people pills that cure belly button lint, we have to give a different group placebo (sugar) pills. Only the comparison between drug and placebo groups can tell us if the drug worked, because maybe the changing seasons, regular doctor's visits, or having your belly button examined once a week affects the likelihood of lint.
Another tool is called blinding. This is where the patient, and often the doctor and investigators, don't know which pills are placebo and which are drug. This minimizes bias on the part of the patient, and sometimes the doctor and investigators. If the patient knew he were receiving drug rather than placebo, that could influence the outcome. Likewise, investigators who aren't blinded while they're collecting data can unconsciously (or consciously) influence it.
Back to diet. I want to know if I react to wheat. I've been gluten-free for about a month. But if I eat a slice of bread, how can I be sure I'm not experiencing symptoms because I think I should? How about blinding and a non-gluten control?
Procedure for a Blinded Wheat Challenge
1. Find a friend who can help you.
2. Buy a loaf of wheat bread and a loaf of gluten-free bread.
3. Have your friend choose one of the loaves without telling you which he/she chose.
4. Have your friend take 1-3 slices, blend them with water in a blender until smooth. This is to eliminate differences in consistency that could allow you to determine what you're eating. Don't watch your friend do this-- you might recognize the loaf.
5. Pinch your nose and drink the "bread smoothie" (yum!). This is so that you can't identify the bread by taste. Rinse your mouth with water before releasing your nose. Record how you feel in the next few hours and days.
6. Wait a week. This is called a "washout period". Repeat the experiment with the second loaf, attempting to keep everything else about the experiment as similar as possible.
7. Compare how you felt each time. Have your friend "unblind" you by telling you which bread you ate on each day. If you experienced symptoms during the wheat challenge but not the control challenge, you may be sensitive to wheat.
If you want to take this to the next level of scientific rigor, repeat the procedure several times to see if the result is consistent. The larger the effect, the fewer times you need to repeat it to be confident in the result.
* Although it can also be disastrous. People who get into the most trouble are "extreme thinkers" who have a tendency to take an idea too far, e.g., avoid all animal foods, avoid all carbohydrate, avoid all fat, run two marathons a week, etc.
** More subjective forms of inquiry have their own advantages.
HealthCorrelator for Excel (HCE) is now publicly available for free trial
HealthCorrelator for Excel (HCE) is now publicly available for download and use on a free trial basis. For those users who decide to buy it after trying, licenses are available for individuals and organizations. If you are a gym member, consider asking your gym to buy an organizational site license; this would allow the gym to distribute individual licenses at no cost to you and your colleagues.
HCE is a user-friendly Excel-based software that unveils important associations among health variables at the click of a button. Here are some of its main features:
- Easy to use yet powerful health management software.
- Estimates associations among any number of health variables.
- Automatically orders associations by decreasing absolute strength.
- Graphs relationships between pairs of health variables, for all possible combinations.
The beta testing was successfully completed, with fairly positive results. (Thank you beta testers!) Among beta testers were Mac users. The main request from beta testers was for more illustrative material on how to use HCE for specific purposes, such as losing body fat or managing blood glucose levels. This will be coming in the future in the form of posts and linked material.
To download a free trial version, good for 30 use sessions (which is quite a lot!), please visit the HealthCorrelator.com web site. There you will also find the software’s User Manual and various links to demo YouTube videos. You can also download sample datasets to try the software’s main features.
Thursday, January 20, 2011
Eating Wheat Gluten Causes Symptoms in Some People Who Don't Have Celiac Disease
Irritable bowel syndrome (IBS) is a condition characterized by the frequent occurrence of abdominal pain, diarrhea, constipation, bloating and/or gas. If that sounds like an extremely broad description, that's because it is. The word "syndrome" is medicalese for "we don't know what causes it." IBS seems to be a catch-all for various persistent digestive problems that aren't defined as separate disorders, and it has a very high prevalence: as high as 14 percent of people in the US, although the estimates depend on what diagnostic criteria are used (1). It can be brought on or exacerbated by several different types of stressors, including emotional stress and infection.
Maelán Fontes Villalba at Lund University recently forwarded me an interesting new paper in the American Journal of Gastroenterology (2). Dr. Jessica R. Biesiekierski and colleagues recruited 34 IBS patients who did not have celiac disease, but who felt they had benefited from going gluten-free in their daily lives*. All patients continued on their pre-study gluten-free diet, however, all participants were provided with two slices of gluten-free bread and one gluten-free muffin per day. The investigators added isolated wheat gluten to the bread and muffins of half the study group.
During the six weeks of the intervention, patients receiving the gluten-free food fared considerably better on nearly every symptom of IBS measured. The most striking difference was in tiredness-- the gluten-free group was much less tired on average than the gluten group. Interestingly, they found that a negative reaction to gluten was not necessarily accompanied by the presence of anti-gluten antibodies in the blood, which is a test often used to diagnose gluten sensitivity.
Here's what I take away from this study:
I don't expect everyone to benefit from avoiding gluten. But for those who are really sensitive, it can make a huge difference. Digestive, autoimmune and neurological disorders associate most strongly with gluten sensitivity. Avoiding gluten can be a fruitful thing to try in cases of mysterious chronic illness. We're two-thirds of the way through Gluten-Free January. I've been fastidiously avoiding gluten, as annoying as it's been at times***. Has anyone noticed a change in their health?
* 56% of volunteers carried HLA-DQ2 or DQ8 alleles, which is slightly higher than the general population. Nearly all people with celiac disease carry one of these two alleles. 28% of volunteers were positive for anti-gliadin IgA, which is higher than the general population.
** Some people feel they are reacting to the fructans in wheat, rather than the gluten. If a modest amount of onion causes the same symptoms as eating wheat, then that may be true. If not, then it's probably the gluten.
*** I'm usually about 95% gluten-free anyway. But when I want a real beer, I want one brewed with barley. And when I want Thai food or sushi, I don't worry about a little bit of wheat in the soy sauce. If a friend makes me food with gluten in it, I'll eat it and enjoy it. This month I'm 100% gluten-free though, because I can't in good conscience encourage my blog readership to try it if I'm not doing it myself. At the end of the month, I'm going to do a blinded gluten challenge (with a gluten-free control challenge) to see once and for all if I react to it. Stay tuned for more on that.
Maelán Fontes Villalba at Lund University recently forwarded me an interesting new paper in the American Journal of Gastroenterology (2). Dr. Jessica R. Biesiekierski and colleagues recruited 34 IBS patients who did not have celiac disease, but who felt they had benefited from going gluten-free in their daily lives*. All patients continued on their pre-study gluten-free diet, however, all participants were provided with two slices of gluten-free bread and one gluten-free muffin per day. The investigators added isolated wheat gluten to the bread and muffins of half the study group.
During the six weeks of the intervention, patients receiving the gluten-free food fared considerably better on nearly every symptom of IBS measured. The most striking difference was in tiredness-- the gluten-free group was much less tired on average than the gluten group. Interestingly, they found that a negative reaction to gluten was not necessarily accompanied by the presence of anti-gluten antibodies in the blood, which is a test often used to diagnose gluten sensitivity.
Here's what I take away from this study:
- Wheat gluten can cause symptoms in susceptible people who do not have celiac disease.
- A lack of circulating antibodies against gluten does not necessarily indicate a lack of gluten sensitivity.
- People with mysterious digestive problems may want to try avoiding gluten for a while to see if it improves their symptoms**.
- People with mysterious fatigue may want to try avoiding gluten.
I don't expect everyone to benefit from avoiding gluten. But for those who are really sensitive, it can make a huge difference. Digestive, autoimmune and neurological disorders associate most strongly with gluten sensitivity. Avoiding gluten can be a fruitful thing to try in cases of mysterious chronic illness. We're two-thirds of the way through Gluten-Free January. I've been fastidiously avoiding gluten, as annoying as it's been at times***. Has anyone noticed a change in their health?
* 56% of volunteers carried HLA-DQ2 or DQ8 alleles, which is slightly higher than the general population. Nearly all people with celiac disease carry one of these two alleles. 28% of volunteers were positive for anti-gliadin IgA, which is higher than the general population.
** Some people feel they are reacting to the fructans in wheat, rather than the gluten. If a modest amount of onion causes the same symptoms as eating wheat, then that may be true. If not, then it's probably the gluten.
*** I'm usually about 95% gluten-free anyway. But when I want a real beer, I want one brewed with barley. And when I want Thai food or sushi, I don't worry about a little bit of wheat in the soy sauce. If a friend makes me food with gluten in it, I'll eat it and enjoy it. This month I'm 100% gluten-free though, because I can't in good conscience encourage my blog readership to try it if I'm not doing it myself. At the end of the month, I'm going to do a blinded gluten challenge (with a gluten-free control challenge) to see once and for all if I react to it. Stay tuned for more on that.
Saturday, January 15, 2011
Do you lose muscle if you lift weights after a 24-hour fast? Probably not if you do that regularly
Compensatory adaptation (CA) is an idea that is useful in the understanding of how the body reacts to inputs like dietary intake of macronutrients and exercise. CA is a complex process, because it involves feedback loops, but it leads to adaptations that are fairly general, applying to a large cross-section of the population.
A joke among software developers is that the computer does exactly what you tell it to do, but not necessarily what you want it to do. Similarly, through CA your body responds exactly to the inputs you give it, but not necessarily in the way you would like it to respond. For example, a moderate caloric deficit may lead to slow body fat loss, while a very high caloric deficit may bring body fat loss to a halt.
Strength training seems to lead to various adaptations, which can be understood through the lens provided by CA. One of them is a dramatic increase in the ability of the body to store glycogen, in both liver and muscle. Glycogen is the main fuel used by muscle during anaerobic exercise. Regular strength training causes, over time, glycogen stores to more than double. And about 2.6 the amount of glycogen is also stored as water.
When one looks bigger and becomes stronger as a result of strength training, that is in no small part due to increases in glycogen and water stored. More glycogen stored in muscle leads to more strength, which is essentially a measure of one’s ability to move a certain amount of weight around. More muscle protein is also associated with more strength.
Thinking in terms of CA, the increase in the body’s ability to store glycogen is to be expected, as long as glycogen stores are depleted and replenished on a regular basis. By doing strength training regularly, you are telling your body that you need a lot of glycogen on a regular basis, and the body responds. But if you do not replenish your glycogen stores on a regular basis, you are also sending your body a conflicting message, which is that dietary sources of the substances used to make glycogen are not readily available. Among the substances that are used to make glycogen, the best seems to be the combination of fructose and glucose that one finds in fruits.
Let us assume a 160-lbs untrained person, John, who stored about 100 g of glycogen in his liver, and about 500 g in his muscle cells, before starting a strength training program. Let us assume, conservatively, that after 6 months of training he increased the size of his liver glycogen tank to 150 g. Muscle glycogen storage was also increased, but that is less relevant for the discussion in this post.
Then John fasted for 24 hours before a strength training session, just to see what would happen. While fasting he went about his business, doing light activities, which led to a caloric expenditure of about 100 calories per hour (equivalent to 2400 per day). About 20 percent of that, or 20 calories per hour, came from a combination of blood glucose and ketones. Contrary to popular belief, ketones can always be found in circulation. If only glucose were used, 5 g of glucose per hour would be needed to supply those 20 calories.
During the fast, John’s glucose needs, driven primarily by his brain’s needs, were met by conversion of liver glycogen to blood glucose. His muscle glycogen was pretty much “locked” during the fast; because he was doing only light activities, which rely primarily on fat as fuel. Muscle glycogen is “unlocked” through anaerobic exercise, of which strength training is an instance.
One of the roles of ketones is to spare liver glycogen, delaying the use of muscle protein to make glucose down the road, so the percentage of ketones in circulation in John’s body increased in a way that was inversely proportional to stored liver glycogen. According to this study, after 72 hours fasting about 25 percent of the body’s glucose needs are met by ketones. (This may be an underestimation.)
If we assume a linear increase in ketone concentration, this leads to a 0.69 percent increase in circulating ketones for every 2-hour period. (This is a simplification, as the increase is very likely nonlinear.) So, when we look at John’s liver glycogen tank, it probably went down in a way similar to that depicted on the figure below. The blue bars show liver glycogen at the end of each 2-hour period. The red bars show the approximate amount of glucose consumed during each 2-hour period. Glucose consumed goes down as liver glycogen decreases, because of the increase in blood ketones.

As you can see, after a 24-hour fast, John had about 35 g of glycogen left, which is enough for a few extra hours of fasting. At the 24-hour mark the body had no need to be using muscle protein to generate glucose. Maybe some of that happened, but probably not much if John was relaxed during the fast. (If he was stressed out, stress hormones would have increased blood glucose release significantly.) From the body’s perspective, muscle is “expensive”, whereas body fat is “cheap”. And body fat, converted to free fatty acids, is what is used to produce ketones during a fast.
Blood ketone concentration does not go up dramatically during a 24-hour fast, but it does after a 48-hour fast, when it becomes about 10 times higher. This major increase occurs primarily to spare muscle, including heart muscle. If the increase is much smaller during a 24-hour fast, one can reasonably assume that the body is not going to be using muscle during the fast. It can still rely on liver glycogen, together with a relatively small amount of ketones.
Then John did his strength training, after the 24-hour fast. When he did that, the muscles he used in the exercise session converted locally stored glycogen into lactate. A flood of lactate was secreted into the bloodstream, which was used by his liver to produce glucose and also to replenish liver glycogen a bit. Again, at this stage there was no need for John’s body to use muscle protein to generate glucose.
Counterintuitive as this may sound, the more different muscles John used, the more lactate was made available. If John did 20 sets of isolated bicep curls, for example, his body would not have released enough lactate to meet its glucose needs or replenish liver glycogen. As a result, stress hormones would go up a lot, and his body would send him some alarm signals. One of those signals is a feeling of “pins and needles”, which is sometimes confused with the symptoms of a heart attack.
John worked out various muscle groups for 30 minutes or so, and he did not even feel fatigued. He felt energetic, in part because his blood glucose went up a lot, peaking at 150 mg/dl, to meet muscle needs. This elevated blood glucose was caused by his liver producing blood glucose based on lactate and releasing it into his blood. Muscle glycogen was depleted as a result of that.
Do you lose any muscle if you lift weights after a 24-hour fast?
I don’t think so, if you deplete your glycogen stores by doing strength training on a regular basis, and also replenish them on a regular basis. In fact, your liver glycogen tank will increase in size, and you may find yourself being able to fast for many hours without feeling hungry.
You will feel hungry after the strength training session following the fast though; probably ravenous.
References
Brooks, G.A., Fahey, T.D., & Baldwin, K.M. (2005). Exercise physiology: Human bioenergetics and its applications. Boston, MA: McGraw-Hill.
Wilmore, J.H., Costill, D.L., & Kenney, W.L. (2007). Physiology of sport and exercise. Champaign, IL: Human Kinetics.
A joke among software developers is that the computer does exactly what you tell it to do, but not necessarily what you want it to do. Similarly, through CA your body responds exactly to the inputs you give it, but not necessarily in the way you would like it to respond. For example, a moderate caloric deficit may lead to slow body fat loss, while a very high caloric deficit may bring body fat loss to a halt.
Strength training seems to lead to various adaptations, which can be understood through the lens provided by CA. One of them is a dramatic increase in the ability of the body to store glycogen, in both liver and muscle. Glycogen is the main fuel used by muscle during anaerobic exercise. Regular strength training causes, over time, glycogen stores to more than double. And about 2.6 the amount of glycogen is also stored as water.
When one looks bigger and becomes stronger as a result of strength training, that is in no small part due to increases in glycogen and water stored. More glycogen stored in muscle leads to more strength, which is essentially a measure of one’s ability to move a certain amount of weight around. More muscle protein is also associated with more strength.
Thinking in terms of CA, the increase in the body’s ability to store glycogen is to be expected, as long as glycogen stores are depleted and replenished on a regular basis. By doing strength training regularly, you are telling your body that you need a lot of glycogen on a regular basis, and the body responds. But if you do not replenish your glycogen stores on a regular basis, you are also sending your body a conflicting message, which is that dietary sources of the substances used to make glycogen are not readily available. Among the substances that are used to make glycogen, the best seems to be the combination of fructose and glucose that one finds in fruits.
Let us assume a 160-lbs untrained person, John, who stored about 100 g of glycogen in his liver, and about 500 g in his muscle cells, before starting a strength training program. Let us assume, conservatively, that after 6 months of training he increased the size of his liver glycogen tank to 150 g. Muscle glycogen storage was also increased, but that is less relevant for the discussion in this post.
Then John fasted for 24 hours before a strength training session, just to see what would happen. While fasting he went about his business, doing light activities, which led to a caloric expenditure of about 100 calories per hour (equivalent to 2400 per day). About 20 percent of that, or 20 calories per hour, came from a combination of blood glucose and ketones. Contrary to popular belief, ketones can always be found in circulation. If only glucose were used, 5 g of glucose per hour would be needed to supply those 20 calories.
During the fast, John’s glucose needs, driven primarily by his brain’s needs, were met by conversion of liver glycogen to blood glucose. His muscle glycogen was pretty much “locked” during the fast; because he was doing only light activities, which rely primarily on fat as fuel. Muscle glycogen is “unlocked” through anaerobic exercise, of which strength training is an instance.
One of the roles of ketones is to spare liver glycogen, delaying the use of muscle protein to make glucose down the road, so the percentage of ketones in circulation in John’s body increased in a way that was inversely proportional to stored liver glycogen. According to this study, after 72 hours fasting about 25 percent of the body’s glucose needs are met by ketones. (This may be an underestimation.)
If we assume a linear increase in ketone concentration, this leads to a 0.69 percent increase in circulating ketones for every 2-hour period. (This is a simplification, as the increase is very likely nonlinear.) So, when we look at John’s liver glycogen tank, it probably went down in a way similar to that depicted on the figure below. The blue bars show liver glycogen at the end of each 2-hour period. The red bars show the approximate amount of glucose consumed during each 2-hour period. Glucose consumed goes down as liver glycogen decreases, because of the increase in blood ketones.
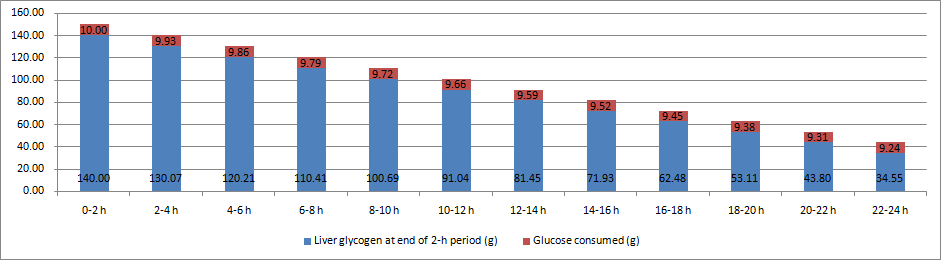
As you can see, after a 24-hour fast, John had about 35 g of glycogen left, which is enough for a few extra hours of fasting. At the 24-hour mark the body had no need to be using muscle protein to generate glucose. Maybe some of that happened, but probably not much if John was relaxed during the fast. (If he was stressed out, stress hormones would have increased blood glucose release significantly.) From the body’s perspective, muscle is “expensive”, whereas body fat is “cheap”. And body fat, converted to free fatty acids, is what is used to produce ketones during a fast.
Blood ketone concentration does not go up dramatically during a 24-hour fast, but it does after a 48-hour fast, when it becomes about 10 times higher. This major increase occurs primarily to spare muscle, including heart muscle. If the increase is much smaller during a 24-hour fast, one can reasonably assume that the body is not going to be using muscle during the fast. It can still rely on liver glycogen, together with a relatively small amount of ketones.
Then John did his strength training, after the 24-hour fast. When he did that, the muscles he used in the exercise session converted locally stored glycogen into lactate. A flood of lactate was secreted into the bloodstream, which was used by his liver to produce glucose and also to replenish liver glycogen a bit. Again, at this stage there was no need for John’s body to use muscle protein to generate glucose.
Counterintuitive as this may sound, the more different muscles John used, the more lactate was made available. If John did 20 sets of isolated bicep curls, for example, his body would not have released enough lactate to meet its glucose needs or replenish liver glycogen. As a result, stress hormones would go up a lot, and his body would send him some alarm signals. One of those signals is a feeling of “pins and needles”, which is sometimes confused with the symptoms of a heart attack.
John worked out various muscle groups for 30 minutes or so, and he did not even feel fatigued. He felt energetic, in part because his blood glucose went up a lot, peaking at 150 mg/dl, to meet muscle needs. This elevated blood glucose was caused by his liver producing blood glucose based on lactate and releasing it into his blood. Muscle glycogen was depleted as a result of that.
Do you lose any muscle if you lift weights after a 24-hour fast?
I don’t think so, if you deplete your glycogen stores by doing strength training on a regular basis, and also replenish them on a regular basis. In fact, your liver glycogen tank will increase in size, and you may find yourself being able to fast for many hours without feeling hungry.
You will feel hungry after the strength training session following the fast though; probably ravenous.
References
Brooks, G.A., Fahey, T.D., & Baldwin, K.M. (2005). Exercise physiology: Human bioenergetics and its applications. Boston, MA: McGraw-Hill.
Wilmore, J.H., Costill, D.L., & Kenney, W.L. (2007). Physiology of sport and exercise. Champaign, IL: Human Kinetics.
Thursday, January 13, 2011
Does Dietary Saturated Fat Increase Blood Cholesterol? An Informal Review of Observational Studies
The diet-heart hypothesis states three things:

The relationship becomes much more complex when you consider lipoprotein subtypes, density and oxidation level, among other factors, but at the very least there is an association between habitual blood cholesterol level and heart attack risk. This is what you would want to see if your hypothesis states that high blood cholesterol causes heart attacks.
Now let's turn to the first contention, the hypothesis that dietary saturated fat increases serum cholesterol. This idea is so deeply ingrained in the scientific literature that many authors don't even bother providing references for it anymore. When references are provided, they nearly always point to the same type of study: short-term controlled diet trials, in which volunteers are fed different fats for 2-13 weeks and their blood cholesterol measured (2)*. These studies show that saturated fat increases both LDL cholesterol ("bad cholesterol") and HDL cholesterol ("good cholesterol"), but typically the former more than the latter. These are the studies on which the diet-heart hypothesis was built.
But now we have a problem. Nearly every high-quality (prospective) observational study ever conducted found that saturated fat intake is not associated with heart attack risk (3). So if saturated fat increases blood cholesterol, and higher blood cholesterol is associated with an increased risk of having a heart attack, then why don't people who eat more saturated fat have more heart attacks?
I'll begin to answer that question with another question: why do researchers almost never cite observational studies to support the idea that dietary saturated fat increases blood cholesterol? Surely if the hypothesis is correct, then people who habitually eat a lot of saturated fat should have high cholesterol, right? One reason may be that in most instances, when researchers have looked for a relationship between habitual saturated fat intake and blood cholesterol, it has been very small or nonexistent. Those findings are rarely cited, but let's have a look...
The Studies
It's difficult to do a complete accounting of these studies, but I've done my best to round them up. I can't claim this post is comprehensive, but I doubt I missed very many, and I certainly didn't exclude any that I came across. If you know of any I missed, please add them to the comments. [UPDATE 4-2012: I did miss several studies, although they're basically consistent with the conclusion I came to here. I plan to update this post with the new references at some point.]
The earliest and perhaps most interesting study I found was published in the British Medical Journal in 1963 and is titled "Diet and Plasma Cholesterol in 99 Bank Men" (4). Investigators asked volunteers to weigh all food consumed at home for 1-2 weeks, and describe in detail all food consumed away from home. Compliance was good. This dietary accounting method is much more accurate than in most observational studies today**. Animal fat intake ranged from 55 to 173 grams per day, and blood cholesterol ranged from 154 to 324 mg/dL, yet there was no relationship whatsoever between the two. I'm looking at a graph of animal fat intake vs. blood cholesterol as I write this, and it looks like someone shot it with a shotgun at 50 yards. They analyzed the data every which way, but were never able to squeeze even a hint of an association out of it:
The next study is the Bogalusa Heart Study, published in 1978, which studied the diet and health of 10 year old American children (8). This study found an association by one statistical method, and none by a second method****. They found that the dietary factors they analyzed explained no more than 4% of the variation in blood cholesterol. Overall, I think this study lends very little support to the hypothesis.
Next is the Western Electric study, published in 1981 (9). This study found an association between saturated fat intake and blood cholesterol in middle-aged men in Chicago. However, the correlation was small, and there was no association between saturated fat intake and heart attack deaths. They cited two other studies that found an association between dietary saturated fat and blood cholesterol (and did not cite any of the numerous studies that found no association). One was a very small study conducted in young men doing research in Antarctica, which did not measure saturated fat but found an association between total fat intake and blood cholesterol (10). The other studied Japanese (Nagasaki and Hiroshima) and Japanese Americans in Japan, Hawai'i and California respectively (11).
This study requires some discussion. Published in 1973, it found a correlation between saturated fat intake and blood cholesterol in Japan, Hawai'i but not in California. The strongest association was in Japan, where going from 5 to 75 g/day of saturated fat (a 15-fold change!) was associated with an increase in blood cholesterol from about 175 to 200 mg/dL. However, I don't think this study offers much support to the hypothesis upon closer examination. Food intake in Japan was collected by 24-hour recall in 1965-1967, when the diet was roughly 3/4 white rice by calories. The lower limit of saturated fat intake in Japan was 5g/day, 1/12th what was typically eaten in Hawai'i and California, and the Japanese average was 16g, with most people falling below 10g. That is an extraordinarily low saturated fat intake. I think a significant portion of the Japanese in this study, living in the war-ravaged cities of Nagasaki and Hiroshima, were over-reliant on white rice and had a very peculiar and perhaps deficient diet. Also, what is the difference between a diet with 5 and 75 grams of saturated fat per day? Those diets are probably very different, in many other ways than their saturated fat content.
In Japanese-Americans living in Hawai'i, over a range of saturated fat intakes between 5 and 110 g/day, cholesterol went from 210 to 220 mg/dL. That was statistically significant but it's not exactly knocking my socks off, considering it's a 22-fold difference in saturated fat intake. In California, going from 15 to 110 g/day of saturated fat (7.3-fold change) was not associated with a change in blood cholesterol. Blood cholesterol was 20-30 mg/dL lower in Japan than in Hawai'i or California at any given level of saturated fat intake (e.g., Japanese eating 30g per day vs. Hawai'ians eating 30g per day). I think it's probable that saturated fat is not the relevant factor here, or at least it's much less influential than other factors. An equally plausible explanation is that people in the very low range of saturated fat intake are the rural poor who eat a diet that differs in many ways from the diets at the upper end of the range, and other aspects of lifestyle such as physical activity also differ.
The most recent study was the Health Professional Follow-up study, published in 1996 (12). This was a massive, well funded study that found no relationship between saturated fat intake and blood cholesterol.
Conclusion
Of all the studies I came across, only the Western Electric study found a clear association between habitual saturated fat intake and blood cholesterol, and even that association was weak. The Bogalusa Heart study and the Japanese study provided inconsistent evidence for a weak association. The other studies I cited, including the bank workers' study, the Tecumseh study, the Evans county study, the Israel Ischemic Heart study, the Framingham study and the Health Professionals Follow-up study, found no association between the two factors.
Overall, the literature does not offer much support for the idea that long term saturated fat intake has a significant effect on the concentration of blood cholesterol in humans. If it's a factor at all, it must be rather weak. It may be that the diet-heart hypothesis rests in part on an over-reliance on the results of short-term controlled feeding studies. It would be nice to see this discussed more often (or at all) in the scientific literature. It is worth pointing out that the method used to collect diet information in most of these studies, the food frequency questionnaire, is not particularly accurate, so it's possible that there is a lot of variability inherent to the measurement that is partially masking an association. In any case, these controlled studies have typically shown that saturated fat increases both LDL and HDL, so even if saturated fat did have a modest long-term effect on blood cholesterol, as hinted at by some of the observational studies, its effect on heart attack risk would still be difficult to predict.
The Diet-heart Hypothesis: Stuck at the Starting Gate
Animal Models of Atherosclerosis: LDL
* As a side note, many of these studies were of poor quality, and were designed in ways that artificially inflated the effects of saturated fat on blood lipids. For example, using a run-in period high in linoleic acid, or comparing a saturated fat-rich diet to a linoleic acid-rich diet, and attributing the differences in blood cholesterol to the saturated fat. Some of them used hydrogenated seed oils as the saturated fat. Although not always consistent, I do think that overall these studies support the idea that saturated fat does have a modest ability to increase blood cholesterol in the short term.
** Although I would love to hear comments from anyone who has done controlled diet trials. I'm sure this method had flaws, as it was applied in the 1960s.
*** Reference cited in the Tecumseh paper: Kannel, W et al. The Framingham Study. An epidemiological Investigation of Cardiovascular Diseases. Section 24: The Framingham Diet Study: Diet and the Regulation of Serum Cholesterol. US Government Printing Office, 1970.
**** Table 5 shows that the Pearson correlation coefficient for saturated fat intake vs. blood cholesterol is not significant; table 6 shows that children in the two highest tertiles of blood cholesterol have a significantly higher intake of saturated fat, unsaturated fat, total fat and sodium than the lowest tertile. The relationship between saturated fat and blood cholesterol shows no evidence of dose-dependence (cholesterol tertiles= 15.6g, 18.4g, 18.5g saturated fat). The investigators did not attempt to adjust for confounding factors.
- Dietary saturated fat increases blood cholesterol
- Elevated blood cholesterol increases the risk of having a heart attack
- Therefore, dietary saturated fat increases the risk of having a heart attack

The relationship becomes much more complex when you consider lipoprotein subtypes, density and oxidation level, among other factors, but at the very least there is an association between habitual blood cholesterol level and heart attack risk. This is what you would want to see if your hypothesis states that high blood cholesterol causes heart attacks.
Now let's turn to the first contention, the hypothesis that dietary saturated fat increases serum cholesterol. This idea is so deeply ingrained in the scientific literature that many authors don't even bother providing references for it anymore. When references are provided, they nearly always point to the same type of study: short-term controlled diet trials, in which volunteers are fed different fats for 2-13 weeks and their blood cholesterol measured (2)*. These studies show that saturated fat increases both LDL cholesterol ("bad cholesterol") and HDL cholesterol ("good cholesterol"), but typically the former more than the latter. These are the studies on which the diet-heart hypothesis was built.
But now we have a problem. Nearly every high-quality (prospective) observational study ever conducted found that saturated fat intake is not associated with heart attack risk (3). So if saturated fat increases blood cholesterol, and higher blood cholesterol is associated with an increased risk of having a heart attack, then why don't people who eat more saturated fat have more heart attacks?
I'll begin to answer that question with another question: why do researchers almost never cite observational studies to support the idea that dietary saturated fat increases blood cholesterol? Surely if the hypothesis is correct, then people who habitually eat a lot of saturated fat should have high cholesterol, right? One reason may be that in most instances, when researchers have looked for a relationship between habitual saturated fat intake and blood cholesterol, it has been very small or nonexistent. Those findings are rarely cited, but let's have a look...
The Studies
It's difficult to do a complete accounting of these studies, but I've done my best to round them up. I can't claim this post is comprehensive, but I doubt I missed very many, and I certainly didn't exclude any that I came across. If you know of any I missed, please add them to the comments. [UPDATE 4-2012: I did miss several studies, although they're basically consistent with the conclusion I came to here. I plan to update this post with the new references at some point.]
The earliest and perhaps most interesting study I found was published in the British Medical Journal in 1963 and is titled "Diet and Plasma Cholesterol in 99 Bank Men" (4). Investigators asked volunteers to weigh all food consumed at home for 1-2 weeks, and describe in detail all food consumed away from home. Compliance was good. This dietary accounting method is much more accurate than in most observational studies today**. Animal fat intake ranged from 55 to 173 grams per day, and blood cholesterol ranged from 154 to 324 mg/dL, yet there was no relationship whatsoever between the two. I'm looking at a graph of animal fat intake vs. blood cholesterol as I write this, and it looks like someone shot it with a shotgun at 50 yards. They analyzed the data every which way, but were never able to squeeze even a hint of an association out of it:
Making the most out of the data in other ways- for example, by analysis of the men very stable in their diets, or in whom weighing of food intake was maximal, or where blood was taken close to the diet [measurement]- did not increase the correlation. Because the correlation coefficient is almost as often negative as positive, moreover, what is being discussed mostly is the absence of association, not merely association that is unexpectedly small.The next study to discuss is the 1976 Tecumseh study (5). This was a large cardiovascular observational study conducted in Tecumseh, Michigan, which is often used as the basis for comparison for other cardiovascular studies in the literature. Using the 24 hour dietary recall method, including an analysis of saturated fat, the investigators found that:
Cholesterol and triglyceride levels were unrelated to quality, quantity, or proportions of fat, carbohydrate or protein consumed in the 24-hr recall period.They also noted that the result was consistent with what had been reported in other previously published studies, including the Evans county study (6), the massive Israel Ischemic Heart Disease Study (7) and the Framingham study. One of the longest-running, most comprehensive and most highly cited observational studies, the Framingham study was organized by Harvard investigators and continues to this day. When investigators analyzed the relationship between saturated fat intake, serum cholesterol and heart attack risk, they were so disappointed that they never formally published the results. We know from multiple sources that they found no significant relationship between saturated fat intake and blood cholesterol or heart attack risk***.
The next study is the Bogalusa Heart Study, published in 1978, which studied the diet and health of 10 year old American children (8). This study found an association by one statistical method, and none by a second method****. They found that the dietary factors they analyzed explained no more than 4% of the variation in blood cholesterol. Overall, I think this study lends very little support to the hypothesis.
Next is the Western Electric study, published in 1981 (9). This study found an association between saturated fat intake and blood cholesterol in middle-aged men in Chicago. However, the correlation was small, and there was no association between saturated fat intake and heart attack deaths. They cited two other studies that found an association between dietary saturated fat and blood cholesterol (and did not cite any of the numerous studies that found no association). One was a very small study conducted in young men doing research in Antarctica, which did not measure saturated fat but found an association between total fat intake and blood cholesterol (10). The other studied Japanese (Nagasaki and Hiroshima) and Japanese Americans in Japan, Hawai'i and California respectively (11).
This study requires some discussion. Published in 1973, it found a correlation between saturated fat intake and blood cholesterol in Japan, Hawai'i but not in California. The strongest association was in Japan, where going from 5 to 75 g/day of saturated fat (a 15-fold change!) was associated with an increase in blood cholesterol from about 175 to 200 mg/dL. However, I don't think this study offers much support to the hypothesis upon closer examination. Food intake in Japan was collected by 24-hour recall in 1965-1967, when the diet was roughly 3/4 white rice by calories. The lower limit of saturated fat intake in Japan was 5g/day, 1/12th what was typically eaten in Hawai'i and California, and the Japanese average was 16g, with most people falling below 10g. That is an extraordinarily low saturated fat intake. I think a significant portion of the Japanese in this study, living in the war-ravaged cities of Nagasaki and Hiroshima, were over-reliant on white rice and had a very peculiar and perhaps deficient diet. Also, what is the difference between a diet with 5 and 75 grams of saturated fat per day? Those diets are probably very different, in many other ways than their saturated fat content.
In Japanese-Americans living in Hawai'i, over a range of saturated fat intakes between 5 and 110 g/day, cholesterol went from 210 to 220 mg/dL. That was statistically significant but it's not exactly knocking my socks off, considering it's a 22-fold difference in saturated fat intake. In California, going from 15 to 110 g/day of saturated fat (7.3-fold change) was not associated with a change in blood cholesterol. Blood cholesterol was 20-30 mg/dL lower in Japan than in Hawai'i or California at any given level of saturated fat intake (e.g., Japanese eating 30g per day vs. Hawai'ians eating 30g per day). I think it's probable that saturated fat is not the relevant factor here, or at least it's much less influential than other factors. An equally plausible explanation is that people in the very low range of saturated fat intake are the rural poor who eat a diet that differs in many ways from the diets at the upper end of the range, and other aspects of lifestyle such as physical activity also differ.
The most recent study was the Health Professional Follow-up study, published in 1996 (12). This was a massive, well funded study that found no relationship between saturated fat intake and blood cholesterol.
Conclusion
Of all the studies I came across, only the Western Electric study found a clear association between habitual saturated fat intake and blood cholesterol, and even that association was weak. The Bogalusa Heart study and the Japanese study provided inconsistent evidence for a weak association. The other studies I cited, including the bank workers' study, the Tecumseh study, the Evans county study, the Israel Ischemic Heart study, the Framingham study and the Health Professionals Follow-up study, found no association between the two factors.
Overall, the literature does not offer much support for the idea that long term saturated fat intake has a significant effect on the concentration of blood cholesterol in humans. If it's a factor at all, it must be rather weak. It may be that the diet-heart hypothesis rests in part on an over-reliance on the results of short-term controlled feeding studies. It would be nice to see this discussed more often (or at all) in the scientific literature. It is worth pointing out that the method used to collect diet information in most of these studies, the food frequency questionnaire, is not particularly accurate, so it's possible that there is a lot of variability inherent to the measurement that is partially masking an association. In any case, these controlled studies have typically shown that saturated fat increases both LDL and HDL, so even if saturated fat did have a modest long-term effect on blood cholesterol, as hinted at by some of the observational studies, its effect on heart attack risk would still be difficult to predict.
The Diet-heart Hypothesis: Stuck at the Starting Gate
Animal Models of Atherosclerosis: LDL
* As a side note, many of these studies were of poor quality, and were designed in ways that artificially inflated the effects of saturated fat on blood lipids. For example, using a run-in period high in linoleic acid, or comparing a saturated fat-rich diet to a linoleic acid-rich diet, and attributing the differences in blood cholesterol to the saturated fat. Some of them used hydrogenated seed oils as the saturated fat. Although not always consistent, I do think that overall these studies support the idea that saturated fat does have a modest ability to increase blood cholesterol in the short term.
** Although I would love to hear comments from anyone who has done controlled diet trials. I'm sure this method had flaws, as it was applied in the 1960s.
*** Reference cited in the Tecumseh paper: Kannel, W et al. The Framingham Study. An epidemiological Investigation of Cardiovascular Diseases. Section 24: The Framingham Diet Study: Diet and the Regulation of Serum Cholesterol. US Government Printing Office, 1970.
**** Table 5 shows that the Pearson correlation coefficient for saturated fat intake vs. blood cholesterol is not significant; table 6 shows that children in the two highest tertiles of blood cholesterol have a significantly higher intake of saturated fat, unsaturated fat, total fat and sodium than the lowest tertile. The relationship between saturated fat and blood cholesterol shows no evidence of dose-dependence (cholesterol tertiles= 15.6g, 18.4g, 18.5g saturated fat). The investigators did not attempt to adjust for confounding factors.
Tuesday, January 11, 2011
Dr. Fat
A blog reader recently made me a Wordle from Whole Health Source. A Wordle is a graphical representation of a text, where the size of each word represents how often it appears. Click on the image for a larger version.
 Apparently, the two most common words on this blog are "Dr" and "fat." It occurred to me that Dr. Fat would be a great nom de plume.
 Apparently, the two most common words on this blog are "Dr" and "fat." It occurred to me that Dr. Fat would be a great nom de plume.
Monday, January 10, 2011
How come evolution hasn’t made us immortal? Death, like sex, helps animal populations avoid extinction
Genes do not evolve, nor do traits that are coded for our genes. We say that they evolve to facilitate discourse, which is alright. Populations evolve. A new genotype appears in a population and then either spreads or disappears. If it spreads, then the population is said to be evolving with respect to that genotype. A genotype may spread to an entire population; in population genetics, this is called “fixation”.

Asexual reproduction is very uncommon among animals. The most accepted theory to explain this is that animal populations live in environments that change very quickly, and thus need a great deal of genetic diversity within them to cope with the change. Otherwise they disappear, and so do their genes. Asexual reproduction leads to dramatically less genetic diversity in populations than sexual reproduction.
Asexual reproduction is similar to cloning. Each new individual looks a lot like its single parent. This does not work well in populations where individuals live relatively long lives. And even 1 year may be too long in this respect. It is just too much time to wait for a possible new mutation that will bring in some genetic diversity. To complicate matters, genetic mutation does not occur very often, and most genetic mutations are neutral with respect to the phenotype (i.e., they don’t code for any trait).
This is not so much of a problem for species whose members reproduce extremely fast; e.g., produce a new generation in less than 1 hour. A fast-reproducing species usually has a short lifespan as well. Accordingly, asexual reproduction is common among short-lived and fast-reproducing unicellular organisms and pathogens that have no cell structure like viruses.
Bacteria and viruses, in particular, form a part of the environment in which animals live that require animal populations to have a large amount of genetic diversity. Animal populations with low genetic diversity are unlikely to be able to cope with the barrage of diseases caused by these fast-mutating parasites.
We make sex chiefly because of the parasites.
And what about death? What does it bring to the table for a population?
Let us look at the other extreme – immortality. Immortality is very problematic in evolutionary terms because a population of immortal individuals would quickly outgrow its resources. That would happen too fast for the population to evolve enough intelligence to be able to use resources beyond those that were locally available.
In this post I assume that immortality is not the same as indestructibility. Here immortality is equated to the absence of aging as we know it. In this sense, immortals can still die by accident or due to disease. They simply do not age. For immortals, susceptibility to disease does not go up with age.
One could argue that a population of immortal individuals who did not reproduce would have done just fine. But that is not correct, because in this case immortality would be akin to cloning, but worse. Genetic diversity would not grow, as no mutations would occur. The fixed population of immortals would be unable to cope with fast-mutating parasites.
There is so much selection pressure against immortality in nature that it is no surprise that animals of very few species live more than 60 years on average. Humans are at the high end of the longevity scale. They are there for a few reasons. One is that our ancestors had offspring that required extra care, which led to an increase in the parents’ longevity. The offspring required extra care chiefly because of their large brains.
That increase in longevity was likely due to genetic mutations that helped our ancestors extend a lifespan that was programmed to be relatively short. Immortality is not a sound strategy for population survival, and thus there are probably many mechanisms through which it is prevented.
Death is evolution’s main ally. Sex is a very good helper. Both increase genetic diversity in populations.
We can use our knowledge of evolution to live better today. The aging clock can be slowed significantly via evolutionarily sound diet and lifestyle changes, essentially because some of our modern diet and lifestyle choices accelerate aging a lot. But diet and lifestyle changes probably will not make people live to 150.
If we want to become immortal, as we understand it in our current human form, ultimately we may want to beat evolution. In this sense, only very intelligent beings can become immortal.
Maybe we can achieve that by changing our genes, or by learning how to transfer our consciousness “software” into robots. In doing so, however, we may become something different; something that is not human and thus doesn’t see things in the same way as a human does. A conscious robot, without the hormones that so heavily influence human behavior, may find that being alive is pointless.
There is another problem. What if the only natural way to achieve some form of immortality is through organic death, but in a way that we don’t understand? This is not a matter of faith or religion. There are many things that we don’t know for sure. This is probably the biggest mystery of all; one that we cannot unravel in our current human state.

(Human chromosomes capped by telomeres, the white areas at the ends. Telomere shortening is caused by oxidative stress, and seems to be associated with death of cells and organisms. Source: Wikipedia.)
Asexual reproduction is very uncommon among animals. The most accepted theory to explain this is that animal populations live in environments that change very quickly, and thus need a great deal of genetic diversity within them to cope with the change. Otherwise they disappear, and so do their genes. Asexual reproduction leads to dramatically less genetic diversity in populations than sexual reproduction.
Asexual reproduction is similar to cloning. Each new individual looks a lot like its single parent. This does not work well in populations where individuals live relatively long lives. And even 1 year may be too long in this respect. It is just too much time to wait for a possible new mutation that will bring in some genetic diversity. To complicate matters, genetic mutation does not occur very often, and most genetic mutations are neutral with respect to the phenotype (i.e., they don’t code for any trait).
This is not so much of a problem for species whose members reproduce extremely fast; e.g., produce a new generation in less than 1 hour. A fast-reproducing species usually has a short lifespan as well. Accordingly, asexual reproduction is common among short-lived and fast-reproducing unicellular organisms and pathogens that have no cell structure like viruses.
Bacteria and viruses, in particular, form a part of the environment in which animals live that require animal populations to have a large amount of genetic diversity. Animal populations with low genetic diversity are unlikely to be able to cope with the barrage of diseases caused by these fast-mutating parasites.
We make sex chiefly because of the parasites.
And what about death? What does it bring to the table for a population?
Let us look at the other extreme – immortality. Immortality is very problematic in evolutionary terms because a population of immortal individuals would quickly outgrow its resources. That would happen too fast for the population to evolve enough intelligence to be able to use resources beyond those that were locally available.
In this post I assume that immortality is not the same as indestructibility. Here immortality is equated to the absence of aging as we know it. In this sense, immortals can still die by accident or due to disease. They simply do not age. For immortals, susceptibility to disease does not go up with age.
One could argue that a population of immortal individuals who did not reproduce would have done just fine. But that is not correct, because in this case immortality would be akin to cloning, but worse. Genetic diversity would not grow, as no mutations would occur. The fixed population of immortals would be unable to cope with fast-mutating parasites.
There is so much selection pressure against immortality in nature that it is no surprise that animals of very few species live more than 60 years on average. Humans are at the high end of the longevity scale. They are there for a few reasons. One is that our ancestors had offspring that required extra care, which led to an increase in the parents’ longevity. The offspring required extra care chiefly because of their large brains.
That increase in longevity was likely due to genetic mutations that helped our ancestors extend a lifespan that was programmed to be relatively short. Immortality is not a sound strategy for population survival, and thus there are probably many mechanisms through which it is prevented.
Death is evolution’s main ally. Sex is a very good helper. Both increase genetic diversity in populations.
We can use our knowledge of evolution to live better today. The aging clock can be slowed significantly via evolutionarily sound diet and lifestyle changes, essentially because some of our modern diet and lifestyle choices accelerate aging a lot. But diet and lifestyle changes probably will not make people live to 150.
If we want to become immortal, as we understand it in our current human form, ultimately we may want to beat evolution. In this sense, only very intelligent beings can become immortal.
Maybe we can achieve that by changing our genes, or by learning how to transfer our consciousness “software” into robots. In doing so, however, we may become something different; something that is not human and thus doesn’t see things in the same way as a human does. A conscious robot, without the hormones that so heavily influence human behavior, may find that being alive is pointless.
There is another problem. What if the only natural way to achieve some form of immortality is through organic death, but in a way that we don’t understand? This is not a matter of faith or religion. There are many things that we don’t know for sure. This is probably the biggest mystery of all; one that we cannot unravel in our current human state.
Thursday, January 6, 2011
Does strength exercise increase nitrogen balance?
This previous post looks at the amounts of protein needed to maintain a nitrogen balance of zero. It builds on data about individuals doing endurance exercise, which increases the estimates a bit. The post also examines the issue of what happens when more protein than is needed in consumed; including by people doing strength exercise.
What that post does not look into is whether strength exercise, performed at the anaerobic range, increases nitrogen balance. If it did, it may lead to a counterintuitive effect: strength exercise, when practiced at a certain level of intensity, might enable individuals in calorie deficit to retain their muscle, and lose primarily body fat. That is, strength exercise might push the body into burning more body fat and less muscle than it would normally do under calorie deficit conditions.

Under calorie deficit people normally lose both body fat and muscle to meet caloric needs. About 25 percent of lean body mass is lost in sedentary individuals, and 33 percent or more in individuals performing endurance exercise. I suspect that strength exercise has the potential to either bring this percentage down to zero, or to even lead to muscle gain if the calorie deficit is very small. One of the reasons is the data summarized on this post.
Two other reasons are related to what happens with children, and the variation in spontaneous hunger up-regulation in response to various types of exercise. The first reason can be summarized as this: it is very rare for children to be in negative nitrogen balance (Brooks et al., 2005); even when they are under some, not extreme, calorie deficit. It is rare for children to be in negative nitrogen balance even when their daily consumption of protein is below 0.5 g per kg of body weight.
This suggests that, when children are in calorie deficit, they tend to hold on to protein stores (which are critical for growth), and shift their energy consumption to fat more easily than adults. The reason is that developmental growth powerfully stimulates protein synthesis. This leads to a hormonal mix that causes the body to be in anabolic state, even when other forces (e.g., calorie deficit, low protein intake) are pushing it into a catabolic state. In a sense, the tissues of children are always hungry for their building blocks, and they do not let go of them very easily.
The second reason is an interesting variation in the patterns of spontaneous hunger up-regulation in various athletes. The increase in hunger is generally lower for strength than endurance activities. The spontaneous increase for bodybuilders is among the lowest. Since being in a catabolic state tends to have a strong effect on hunger, increasing it significantly, these patterns suggest that strength exercise may actually contribute to placing one in an anabolic state. The duration of this effect is approximately 48 h. Some increase in hunger is expected, because of the increased calorie expenditure during and after strength exercise, but that is counterbalanced somewhat by the start of an anabolic state.
What is going on, and what does this mean for you?
One way to understand what is happening here is to think in terms of compensatory adaptation. Strength exercise, if done properly, tells the body that it needs more muscle protein. Calorie deficit, as long as it is short-term, tells the body that food supply is limited. The body’s short-term response is to keep muscle as much as possible, and use body fat to the largest extent possible to supply the body’s energy needs.
If the right stimuli are supplied in a cyclical manner, no long-term adaptations (e.g., lowered metabolism) will be “perceived” as necessary by the body. Let us consider a 2-day cycle where one does strength exercise on the first day, and rests on the second. A surplus of protein and calories on the first day would lead to both muscle and body fat gain. A deficit on the second day would lead to body fat loss, but not to muscle loss, as long as the deficit is not too extreme. Since only body fat is being lost, more is lost on the second day than on the first.
In this way, one can gain muscle and lose body fat at the same time, which is what seems to have happened with the participants of the Ballor et al. (1996) study. Or, one can keep muscle (not gaining any) and lose more body fat, with a slightly higher calorie deficit. If the calorie deficit is too high, one will enter negative nitrogen balance and lose both muscle and body fat, as often happens with natural bodybuilders in the pre-tournament “cutting” phase.
In a sense, the increase in protein synthesis stimulated by strength exercise is analogous to, although much less strong than, the increase in protein synthesis stimulated by the growth process in children.
References
Ballor, D.L., Harvey-Berino, J.R., Ades, P.A., Cryan, J., & Calles-Escandon, J. (1996). Contrasting effects of resistance and aerobic training on body composition and metabolism after diet-induced weight loss. Metabolism, 45(2), 179-183.
Brooks, G.A., Fahey, T.D., & Baldwin, K.M. (2005). Exercise physiology: Human bioenergetics and its applications. Boston, MA: McGraw-Hill.
What that post does not look into is whether strength exercise, performed at the anaerobic range, increases nitrogen balance. If it did, it may lead to a counterintuitive effect: strength exercise, when practiced at a certain level of intensity, might enable individuals in calorie deficit to retain their muscle, and lose primarily body fat. That is, strength exercise might push the body into burning more body fat and less muscle than it would normally do under calorie deficit conditions.

(Strength exercise combined with a small calorie deficit may be one of the best approaches for body fat loss in women. Photo source: complete-strength-training.com)
Under calorie deficit people normally lose both body fat and muscle to meet caloric needs. About 25 percent of lean body mass is lost in sedentary individuals, and 33 percent or more in individuals performing endurance exercise. I suspect that strength exercise has the potential to either bring this percentage down to zero, or to even lead to muscle gain if the calorie deficit is very small. One of the reasons is the data summarized on this post.
Two other reasons are related to what happens with children, and the variation in spontaneous hunger up-regulation in response to various types of exercise. The first reason can be summarized as this: it is very rare for children to be in negative nitrogen balance (Brooks et al., 2005); even when they are under some, not extreme, calorie deficit. It is rare for children to be in negative nitrogen balance even when their daily consumption of protein is below 0.5 g per kg of body weight.
This suggests that, when children are in calorie deficit, they tend to hold on to protein stores (which are critical for growth), and shift their energy consumption to fat more easily than adults. The reason is that developmental growth powerfully stimulates protein synthesis. This leads to a hormonal mix that causes the body to be in anabolic state, even when other forces (e.g., calorie deficit, low protein intake) are pushing it into a catabolic state. In a sense, the tissues of children are always hungry for their building blocks, and they do not let go of them very easily.
The second reason is an interesting variation in the patterns of spontaneous hunger up-regulation in various athletes. The increase in hunger is generally lower for strength than endurance activities. The spontaneous increase for bodybuilders is among the lowest. Since being in a catabolic state tends to have a strong effect on hunger, increasing it significantly, these patterns suggest that strength exercise may actually contribute to placing one in an anabolic state. The duration of this effect is approximately 48 h. Some increase in hunger is expected, because of the increased calorie expenditure during and after strength exercise, but that is counterbalanced somewhat by the start of an anabolic state.
What is going on, and what does this mean for you?
One way to understand what is happening here is to think in terms of compensatory adaptation. Strength exercise, if done properly, tells the body that it needs more muscle protein. Calorie deficit, as long as it is short-term, tells the body that food supply is limited. The body’s short-term response is to keep muscle as much as possible, and use body fat to the largest extent possible to supply the body’s energy needs.
If the right stimuli are supplied in a cyclical manner, no long-term adaptations (e.g., lowered metabolism) will be “perceived” as necessary by the body. Let us consider a 2-day cycle where one does strength exercise on the first day, and rests on the second. A surplus of protein and calories on the first day would lead to both muscle and body fat gain. A deficit on the second day would lead to body fat loss, but not to muscle loss, as long as the deficit is not too extreme. Since only body fat is being lost, more is lost on the second day than on the first.
In this way, one can gain muscle and lose body fat at the same time, which is what seems to have happened with the participants of the Ballor et al. (1996) study. Or, one can keep muscle (not gaining any) and lose more body fat, with a slightly higher calorie deficit. If the calorie deficit is too high, one will enter negative nitrogen balance and lose both muscle and body fat, as often happens with natural bodybuilders in the pre-tournament “cutting” phase.
In a sense, the increase in protein synthesis stimulated by strength exercise is analogous to, although much less strong than, the increase in protein synthesis stimulated by the growth process in children.
References
Ballor, D.L., Harvey-Berino, J.R., Ades, P.A., Cryan, J., & Calles-Escandon, J. (1996). Contrasting effects of resistance and aerobic training on body composition and metabolism after diet-induced weight loss. Metabolism, 45(2), 179-183.
Brooks, G.A., Fahey, T.D., & Baldwin, K.M. (2005). Exercise physiology: Human bioenergetics and its applications. Boston, MA: McGraw-Hill.
Monday, January 3, 2011
Paleolithic Diet Clinical Trials, Part V
Dr. Staffan Lindeberg's group has published a new paleolithic diet paper in the journal Nutrition and Metabolism, titled "A Paleolithic Diet is More Satiating per Calorie than a Mediterranean-like Diet in Individuals with Ischemic Heart Disease" (1).
The data in this paper are from the same intervention as his group's 2007 paper in Diabetologia (2). To review the results of this paper, 12 weeks of a Paleolithic-style diet caused impressive fat loss and improvement in glucose tolerance, compared to 12 weeks of a Mediterranean-style diet, in volunteers with pre-diabetes or diabetes and ischemic heart disease. Participants who started off with diabetes ended up without it. A Paleolithic diet excludes grains, dairy, legumes and any other category of food that was not a major human food source prior to agriculture. I commented on this study a while back (3, 4).
One of the most intriguing findings in his 2007 study was the low calorie intake of the Paleolithic group. Despite receiving no instruction to reduce calorie intake, the Paleolithic group only ate 1,388 calories per day, compared to 1,823 calories per day for the Mediterranean group*. That's a remarkably low ad libitum calorie intake in the former (and a fairly low intake in the latter as well).
With such a low calorie intake over 12 weeks, you might think the Paleolithic group was starving. Fortunately, the authors had the foresight to measure satiety, or fullness, in both groups during the intervention. They found that satiety was almost identical in the two groups, despite the 24% lower calorie intake of the Paleolithic group. In other words, the Paleolithic group was just as full as the Mediterranean group, despite a considerably lower intake of calories. This implies to me that the body fat "set point" decreased, allowing a reduced calorie intake while body fat stores were burned to make up the calorie deficit. I suspect it also decreased somewhat in the Mediterranean group, although we can't know for sure because we don't have baseline satiety data for comparison.
There are a few possible explanations for this result. The first is that the Paleolithic group was eating more protein, a highly satiating macronutrient. However, given the fact that absolute protein intake was scarcely different between groups, I think this is unlikely to explain the reduced calorie intake.
A second possibility is that certain potentially damaging Neolithic foods (e.g., wheat and refined sugar) interfere with leptin signaling**, and removing them lowers fat mass by allowing leptin to function correctly. Dr. Lindeberg and colleagues authored a hypothesis paper on this topic in 2005 (5).
A third possibility is that a major dietary change of any kind lowers the body fat setpoint and reduces calorie intake for a certain period of time. In support of this hypothesis, both low-carbohydrate and low-fat diet trials show that overweight people spontaneously eat fewer calories when instructed to modify their diets in either direction (6, 7). More extreme changes may cause a larger decrease in calorie intake and fat mass, as evidenced by the results of low-fat vegan diet trials (8, 9). Chris Voigt's potato diet also falls into this category (10, 11). I think there may be something about changing food-related sensory cues that alters the defended level of fat mass. A similar idea is the basis of Seth Roberts' book The Shangri-La Diet.
If I had to guess, I would think the second and third possibilities contributed to the finding that Paleolithic dieters lost more fat without feeling hungry over the 12 week diet period.
*Intakes were determined using 4-day weighed food records.
**Leptin is a hormone produced by body fat that reduces food intake and increases energy expenditure by acting in the brain. The more fat a person carries, the more leptin they produce, and hypothetically this should keep body fat in a narrow window by this form of "negative feedback". Clearly, that's not the whole story, otherwise obesity wouldn't exist. A leading hypothesis is that resistance to the hormone leptin causes this feedback loop to defend a higher level of fat mass.
Subscribe to:
Posts (Atom)