Last week, I attended a Keystone conference, "Neuronal Control of Appetite, Metabolism and Weight", in Banff. Keystone conferences are small, focused meetings that tend to attract high quality science. This particular conference centered around my own professional research interests, and it was incredibly informative. This post is a summary of some of the most salient points.
Rapid Pace of Scientific Progress
Read more »
Showing posts with label diabetes. Show all posts
Showing posts with label diabetes. Show all posts
Sunday, March 24, 2013
Monday, March 11, 2013
The 2013 PLoS ONE sugar and diabetes study: Sugar from fruits is harmless
A new study linking sugar consumption with diabetes prevalence has gained significant media attention recently. The study was published in February 2013 in the journal PLoS ONE (). The authors are Sanjay Basu, Paula Yoffe, Nancy Hills and Robert H. Lustig.
Among the claims made by the media is that “… sugar consumption — independent of obesity — is a major factor behind the recent global pandemic of type 2 diabetes” (). As it turns out, the effects revealed by the study seem to be very small, which may actually be a side effect of data aggregation; I will discuss this further below.
Fruits are exonerated
Let me start by saying that this study also included in the analysis the main natural source of sugar, fruit, as a competing variable (competing with the effects of sugar itself), and found it to be unrelated to diabetes. As the authors note: “None of the other food categories — including fiber-containing foods (pulses, nuts, vegetables, roots, tubers), fruits, meats, cereals, and oils — had a significant association with diabetes prevalence rates”.
This should not surprise anyone who has actually met and talked with Dr. Lustig, the senior author of the study and a very accessible man who has been reaching out to the public in a way that few in his position do. He is a clinician and senior researcher affiliated with a major university; public outreach, in the highly visible way that he does it, is probably something that he does primarily (if not solely) to help people. Dr. Lustig was at the 2012 Ancestral Health Symposium, and he told me, and anyone who asked him, that sugar in industrialized foods was his target, not sugar in fruits.
As I noted here before, the sugar combination of fruits, in their natural package, may in fact be health-promoting (). The natural package probably promotes enough satiety to prevent overconsumption.
Both (unnatural) sugar and obesity have effects, but they are tiny in this study
The Diabetes Report Card 2012 () provides a wealth of information that can be useful as a background for our discussion here.
In the USA, general diabetes prevalence varies depending on state, with some states having higher prevalence than others. The vast majority of diabetes cases are of type 2 diabetes, which is widely believed to be strongly associated with obesity.
In 2012, the diabetes prevalence among adults (aged 20 years or older) in Texas was 9.8 percent. This rate is relatively high compared to other states, although lower than in some. So, among a random group of 1,000 adult Texans, you would find approximately 98 with diabetes.
Prevalence increases with age. Among USA adults in general, prevalence of diabetes is 2.6 percent within ages 20–44, 11.7 percent within ages 45–64, and 18.9 percent at age 64 or older. So the numbers above for Texas, and prevalence in almost any population, are also a reflection of age distribution in the population.
According to the 2013 study published in PLoS ONE, a 1 percent increase in obesity prevalence is associated with a 0.081 percent increase in diabetes prevalence. This comes directly from the table below, fifth column on the right. That is the column for the model that includes all of the variables listed on the left.

We can translate the findings above in more meaningful terms by referring to hypothetical groups of 1,000 people. Let us say we have two groups of 1,000 people. In one of them we have 200 obese people (20 percent); and no obese person in the other. We would find only between 1 and 2 people with diabetes in the group with 200 obese people.
The authors also considered overweight prevalence as a cause of diabetes prevalence. A section of the table with the corresponding results in included below. They also found a significant effect, of smaller size than for obesity – which itself is a small effect.

The study also suggests that consumption of the sugar equivalent of a 12 oz. can of regular soft drink per person per day was associated with a 1.1 percent rise in diabetes prevalence. The effect here is about the same as that of a 1 percent increase in obesity.
That is, let us say we have two groups of 1,000 people. In one of them we have 200 people (20 percent) consuming one 12 oz. can of soft drink per day; and no one consuming sugar in the other. (Sugar from fruits is not considered here.) We would find only about 2 people with diabetes in the group with 200 sugary soda drinkers.
In other words, the effects revealed by this study are very small. They are so small that their corresponding effect sizes make them borderline irrelevant for predictions at the individual level. Based on this study, obesity and sugar consumption combined would account for no more than 5 out of each 100 cases of diabetes (a generous estimate, based on the results discussed above).
Even being weak, the effects revealed by this study are not irrelevant for policy-making, because policies tend to influence the behavior of very large numbers of people. For example, if the number of people that could be influenced by policies to curb consumption of refined sugar were 100 million, the number of cases of diabetes that could be prevented would be 200 thousand, notwithstanding the weak effects revealed by this study.
Why are the effects so small?
The effects in this study are based on data aggregated by country. When data is aggregated by population, the level of variation in the data is reduced; sometimes dramatically, a problem that is proportional to the level of aggregation (e.g., the problem is greater for country aggregation than for city aggregation).
Because there can be no association without correlation, and no correlation without variation, coefficients of association tend to be reduced when data aggregation occurs. This is, in my view, the real problem behind what statisticians often refer to, in “statospeech”, as “ecological fallacy”. The effects in aggregated data are weaker than the effects one would get without aggregation.
So, I suspect that the effects in this study, which are fairly weak at the level of aggregation used (the country level), reflect much stronger effects at the individual level of analysis.
Bottom line
Should you avoid getting obese? Should you avoid consuming industrialized products with added sugar? I think so, and I would still have recommended these without this study. There seems to be no problem with natural foods containing sugar, such as fruits.
This study shows evidence that sugar in industrialized foods is associated with diabetes, independently from obesity, but it does not provide evidence that obesity doesn’t matter. It shows that both matter, independently of one another, which is an interesting finding that backs up Dr. Lustig’s calls for policies to specifically curb refined sugar consumption.
Again, what the study refers to as sugar, as availability but implying consumption, seems to refer mostly to industrialized foods where sugar was added to make them more enticing. Fruit consumption was also included in the study, and found to have no significant effect on diabetes prevalence.
Here is a more interesting question. If a group of people have a predisposition toward developing diabetes, due to any reason (genetic, epigenetic, environmental), what would be the probability that they would develop diabetes if they became obese and/or consumed unnatural sugar-added foods?
This type of question can be answered with a moderating effects analysis, but as I noted here before (), moderating effects analyses are not conducted in health research.

Monday, January 28, 2013
How much alcohol is optimal? Maybe less than you think
I have been regularly recommending to users of the software HCE () to include a column in their health data reflecting their alcohol consumption. Why? Because I suspect that alcohol consumption is behind many of what we call the “diseases of affluence”.
A while ago I recall watching an interview with a centenarian, a very lucid woman. When asked about her “secret” to live a long life, she said that she added a little bit of whiskey to her coffee every morning. It was something like a tablespoon of whiskey, or about 15 g, which amounted to approximately 6 g of ethanol every single day.
Well, she might have been drinking very close to the optimal amount of alcohol per day for the average person, if the study reviewed in this post is correct.
Studies of the effect of alcohol consumption on health generally show results in terms of averages within fixed ranges of consumption. For example, they will show average mortality risks for people consuming 1, 2, 3 etc. drinks per day. These studies suggest that there is a J-curve relationship between alcohol consumption and health (). That is, drinking a little is better than not drinking; and drinking a lot is worse than drinking a little.
However, using “rough” ranges of 1, 2, 3 etc. drinks per day prevents those studies from getting to a more fine-grained picture of the beneficial effects of alcohol consumption.
Contrary to popular belief, the positive health effects of moderate alcohol consumption have little, if anything, to do with polyphenols such as resveratrol. Resveratrol, once believed to be the fountain of youth, is found in the skin of red grapes.
It is in fact the alcohol content that has positive effects, apparently reducing the incidence of coronary heart disease, diabetes, hypertension, congestive heart failure, stroke, dementia, Raynaud’s phenomenon, and all-cause mortality. Raynaud's phenomenon is associated with poor circulation in the extremities (e.g., toes, fingers), which in some cases can progress to gangrene.
In most studies of the effects of alcohol consumption on health, the J-curves emerge from visual inspection of the plots of averages across ranges of consumption. Rarely you find studies where nonlinear relationships are “discovered” by software tools such as WarpPLS (), with effects being adjusted according.
You do find, however, some studies that fit reasonably justified functions to the data. Di Castelnuovo and colleagues’ study, published in JAMA Internal Medicine in 2006 (), is probably the most widely cited among these studies. This study is a meta-analysis; i.e., a study that builds on various other empirical studies.
I think that the journal in which this study appeared was formerly known as Archives of Internal Medicine, a fairly selective and prestigious journal, even though this did not seem to be reflected in its Wikipedia article at the time of this writing ().
What Di Castelnuovo and colleagues found is interesting. They fitted a bunch of nonlinear functions to the data, all with J-curve shapes. The results suggest a lot of variation in the maximum amount one can drink before mortality becomes higher than not drinking at all; that maximum amount ranges from about 4 to 6 drinks per day.
But there is little variation in one respect. The optimal amount of alcohol is somewhere around 5 and 7 g/d, which translates into about the following every day: half a can of beer, half a glass of wine, or half a “shot” of spirit. This is clearly a common trait of all of the nonlinear functions that they generated. This is illustrated in the figure below, from the article.

As you can seen from the curves above, a little bit of alcohol every day seems to have an acute effect on mortality reduction. And it seems that taking little doses every day is much better than taking the equivalent dose over a larger period of time; for instance, the equivalent per week, taken once a week. This is suggested by other studies as well ().
The curves above do not clearly reflect a couple of problems with alcohol consumption. One is that alcohol seems to be treated by the body as a toxin, which causes some harm and some good at the same time, the good being often ascribed to hormesis (). Someone who is more sensitive to alcohol’s harmful effects, on the liver for example, may not benefit as much from its positive effects.
The curves are averages that pass through points, after which the points are forgotten; even though they are real people.
The other problem with alcohol is that most people who are introduced to it in highly urbanized areas (where most people live) tend to drink it because of its mood-altering effects. This leads to a major danger of addiction and abuse. And drinking a lot of alcohol is much worse than not drinking at all.
Interestingly, in traditional Mediterranean Cultures where wine is consumed regularly, people tend to generally frown upon drunkenness ().
A while ago I recall watching an interview with a centenarian, a very lucid woman. When asked about her “secret” to live a long life, she said that she added a little bit of whiskey to her coffee every morning. It was something like a tablespoon of whiskey, or about 15 g, which amounted to approximately 6 g of ethanol every single day.
Well, she might have been drinking very close to the optimal amount of alcohol per day for the average person, if the study reviewed in this post is correct.
Studies of the effect of alcohol consumption on health generally show results in terms of averages within fixed ranges of consumption. For example, they will show average mortality risks for people consuming 1, 2, 3 etc. drinks per day. These studies suggest that there is a J-curve relationship between alcohol consumption and health (). That is, drinking a little is better than not drinking; and drinking a lot is worse than drinking a little.
However, using “rough” ranges of 1, 2, 3 etc. drinks per day prevents those studies from getting to a more fine-grained picture of the beneficial effects of alcohol consumption.
Contrary to popular belief, the positive health effects of moderate alcohol consumption have little, if anything, to do with polyphenols such as resveratrol. Resveratrol, once believed to be the fountain of youth, is found in the skin of red grapes.
It is in fact the alcohol content that has positive effects, apparently reducing the incidence of coronary heart disease, diabetes, hypertension, congestive heart failure, stroke, dementia, Raynaud’s phenomenon, and all-cause mortality. Raynaud's phenomenon is associated with poor circulation in the extremities (e.g., toes, fingers), which in some cases can progress to gangrene.
In most studies of the effects of alcohol consumption on health, the J-curves emerge from visual inspection of the plots of averages across ranges of consumption. Rarely you find studies where nonlinear relationships are “discovered” by software tools such as WarpPLS (), with effects being adjusted according.
You do find, however, some studies that fit reasonably justified functions to the data. Di Castelnuovo and colleagues’ study, published in JAMA Internal Medicine in 2006 (), is probably the most widely cited among these studies. This study is a meta-analysis; i.e., a study that builds on various other empirical studies.
I think that the journal in which this study appeared was formerly known as Archives of Internal Medicine, a fairly selective and prestigious journal, even though this did not seem to be reflected in its Wikipedia article at the time of this writing ().
What Di Castelnuovo and colleagues found is interesting. They fitted a bunch of nonlinear functions to the data, all with J-curve shapes. The results suggest a lot of variation in the maximum amount one can drink before mortality becomes higher than not drinking at all; that maximum amount ranges from about 4 to 6 drinks per day.
But there is little variation in one respect. The optimal amount of alcohol is somewhere around 5 and 7 g/d, which translates into about the following every day: half a can of beer, half a glass of wine, or half a “shot” of spirit. This is clearly a common trait of all of the nonlinear functions that they generated. This is illustrated in the figure below, from the article.

As you can seen from the curves above, a little bit of alcohol every day seems to have an acute effect on mortality reduction. And it seems that taking little doses every day is much better than taking the equivalent dose over a larger period of time; for instance, the equivalent per week, taken once a week. This is suggested by other studies as well ().
The curves above do not clearly reflect a couple of problems with alcohol consumption. One is that alcohol seems to be treated by the body as a toxin, which causes some harm and some good at the same time, the good being often ascribed to hormesis (). Someone who is more sensitive to alcohol’s harmful effects, on the liver for example, may not benefit as much from its positive effects.
The curves are averages that pass through points, after which the points are forgotten; even though they are real people.
The other problem with alcohol is that most people who are introduced to it in highly urbanized areas (where most people live) tend to drink it because of its mood-altering effects. This leads to a major danger of addiction and abuse. And drinking a lot of alcohol is much worse than not drinking at all.
Interestingly, in traditional Mediterranean Cultures where wine is consumed regularly, people tend to generally frown upon drunkenness ().
Wednesday, January 23, 2013
Dogs Eating Carbs
Five years ago, I had an interesting conversation with a veterinarian friend about dog food. We were talking about diabetes in one of the dogs she was treating, and I remarked "that's what happens when you feed a carnivore carbohydrate". She gave me a funny look. At the time, I was seeing the world through the low-carb lens, and I remember thinking how bizarre it was that she didn't yield to my impeccable logic. As they say, live and learn.
The journal Nature published a fascinating paper on the evolution of the domestic dog today (1). Researchers compared the genome of wolves and domestic dogs to see what genetic changes accompanied domestication.
Read more »
The journal Nature published a fascinating paper on the evolution of the domestic dog today (1). Researchers compared the genome of wolves and domestic dogs to see what genetic changes accompanied domestication.
Read more »
Monday, December 10, 2012
Does tallness cause heart disease? No, but sex does
Popular beliefs about medical issues are sometimes motivated by a statistical phenomenon known as “spurious relationship”, among other names. Two variables X and Y are influenced by a third variable C, which leads to X and Y being correlated and thus the impression that X and Y are causally associated.
Take a look at the table below, which I blogged about in a previous post (). This table shows that there is a strong unadjusted correlation between height and arterial stiffness, a marker of heart disease. The likelihood that the correlation is due to chance is lower than one tenth of a percentage point (P<.001).
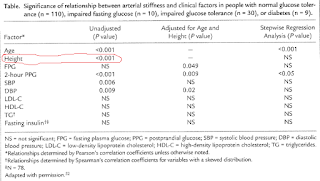
Interestingly, the authors of the study even use height as a control variable to narrow down the “true” causes of arterial stiffness (column with adjusted results), assuming that height did indeed influence arterial stiffness and what they found to be a key predictor of arterial stiffness, 2-hour postprandial glucose.
But there is no convincing evidence that height causes heart disease, with exception of pathological extremes – e.g., acromegaly. Extremes tend to influence statistical results somewhat, leading to conflicting conclusions that end up being disseminated by the popular media (). This is one of the sources of popular beliefs about medical issues.
Another, more important, source are real confounders. And this takes us back to the issue of height being associated with heart disease. In fact, height will typically be significantly associated with heart disease in almost any study that includes men and women and does not control for biological sex.
One of the reasons is that women overall tend to have a significantly lower incident of heart disease than men. The other is that height is significantly lower among women than men, on average, even though there are several women who are taller than the average man.
The table above was from a study including both sexes. Therefore, the strong association between height and arterial stiffness is a “reflection” of the strong association between being male and increased arterial stiffness. If one were to add a variable coded as 0 for male and 1 for female, and use it in a multivariate analysis of predictor of arterial stiffness, together with height, the effect of height would probably “disappear”.
Biological sex is the control variable, the “confounder”, that the authors should have used to narrow down the “true” causes of arterial stiffness (second column in the table). In the absence of biological sex, controlling for height accomplished something similar, but in a “wobbly” way, leaving many readers scratching their heads in confusion.
Take a look at the table below, which I blogged about in a previous post (). This table shows that there is a strong unadjusted correlation between height and arterial stiffness, a marker of heart disease. The likelihood that the correlation is due to chance is lower than one tenth of a percentage point (P<.001).

Interestingly, the authors of the study even use height as a control variable to narrow down the “true” causes of arterial stiffness (column with adjusted results), assuming that height did indeed influence arterial stiffness and what they found to be a key predictor of arterial stiffness, 2-hour postprandial glucose.
But there is no convincing evidence that height causes heart disease, with exception of pathological extremes – e.g., acromegaly. Extremes tend to influence statistical results somewhat, leading to conflicting conclusions that end up being disseminated by the popular media (). This is one of the sources of popular beliefs about medical issues.
Another, more important, source are real confounders. And this takes us back to the issue of height being associated with heart disease. In fact, height will typically be significantly associated with heart disease in almost any study that includes men and women and does not control for biological sex.
One of the reasons is that women overall tend to have a significantly lower incident of heart disease than men. The other is that height is significantly lower among women than men, on average, even though there are several women who are taller than the average man.
The table above was from a study including both sexes. Therefore, the strong association between height and arterial stiffness is a “reflection” of the strong association between being male and increased arterial stiffness. If one were to add a variable coded as 0 for male and 1 for female, and use it in a multivariate analysis of predictor of arterial stiffness, together with height, the effect of height would probably “disappear”.
Biological sex is the control variable, the “confounder”, that the authors should have used to narrow down the “true” causes of arterial stiffness (second column in the table). In the absence of biological sex, controlling for height accomplished something similar, but in a “wobbly” way, leaving many readers scratching their heads in confusion.
Monday, September 10, 2012
Calories and Carbohydrate: a Natural Experiment
In the lab, we work hard to design experiments that help us understand the natural world. But sometimes, nature sets up experiments for us, and all we have to do is collect the data. These are called "natural experiments", and they have led to profound insights in every field of science. For example, Alzheimer's disease is usually not considered a genetic disorder. However, researchers have identified rare cases where AD is inherited in a simple genetic manner. By identifying the genes involved, and what they do, we were able to increase our understanding of the molecular mechanisms of the disease.
The natural experiment I'll be discussing today began in 1989 with the onset of a major economic crisis in Cuba. This coincided with the loss of the Soviet Union as a trading partner, resulting in a massive economic collapse over the next six years, which gradually recovered by 2000.
Read more »
The natural experiment I'll be discussing today began in 1989 with the onset of a major economic crisis in Cuba. This coincided with the loss of the Soviet Union as a trading partner, resulting in a massive economic collapse over the next six years, which gradually recovered by 2000.
Read more »
Sunday, July 22, 2012
New Review Paper by Yours Truly: High-Fat Dairy, Obesity, Metabolic Health and Cardiovascular Disease
My colleagues Drs. Mario Kratz, Ton Baars, and I just published a paper in the European Journal of Nutrition titled "The Relationship Between High-Fat Dairy Consumption and Obesity, Cardiovascular, and Metabolic Disease". Mario is a nutrition researcher at the Fred Hutchinson Cancer Research Center here in Seattle, and friend of mine. He's doing some very interesting research on nutrition and health (with an interest in ancestral diets), and I'm confident that we'll be getting some major insights from his research group in the near future. Mario specializes in tightly controlled human feeding trials. Ton is an agricultural scientist at the University of Kassel in Germany, who specializes in the effect of animal husbandry practices (e.g., grass vs. grain feeding) on the nutritional composition of dairy. None of us have any connection to the dairy industry or any other conflicts of interest.
The paper is organized into three sections:
Read more »
The paper is organized into three sections:
- A comprehensive review of the observational studies that have examined the relationship between high-fat dairy and/or dairy fat consumption and obesity, metabolic health, diabetes, and cardiovascular disease.
- A discussion of the possible mechanisms that could underlie the observational findings.
- Differences between pasture-fed and conventional dairy, and the potential health implications of these differences.
Read more »
Thursday, July 19, 2012
What Causes Type 2 Diabetes, and How Can it be Prevented?
In the comments of the last post, we've been discussing the relationship between body fatness and diabetes risk. I think this is really worth understanding, because type 2 diabetes is one of the few lifestyle disorders where 1) the basic causes are fairly well understood, and 2) we have effective diet/lifestyle prevention strategies that have been clearly supported by multiple controlled trials.
Read more »
Read more »
Monday, April 2, 2012
The 2012 Arch Intern Med red meat-mortality study: Eating 234 g/d of red meat could reduce mortality by 23 percent
As we have seen in an earlier post on the China Study data (), which explored relationships hinted at by Denise Minger’s previous and highly perceptive analysis (), one can use a multivariate analysis tool like WarpPLS () to explore relationships based on data reported by others. This is true even when the dataset available is fairly small.
So I entered the data reported in the most recent (published online in March 2012) study looking at the relationship between red meat consumption and mortality into WarpPLS to do some exploratory analyses. I discussed the study in my previous post; it was conducted by Pan et al. (Frank B. Hu is the senior author) and published in the prestigious Archives of Internal Medicine (). The data I used is from Table 1 of the article; it reports figures on several variables along 5 quintiles, based on separate analyses of two samples, called “Health Professionals” and “Nurses Health” samples. The Health Professionals sample comprised males; the Nurses Health sample, females.
Below is an interesting exploratory model, with results. It includes a number of hypotheses, represented by arrows, which seem to make sense. This is helpful, because a model incorporating hypotheses that make sense allows for easy identification of nonsense results, and thus rejection of the model or the data. (Refutability is one of the most important characteristics of good theoretical models.) Keep in mind that the sample size here is very small (N=10), as the authors of the study reported data along 5 quintiles for the Health Professionals sample, together with 5 quintiles for the Nurses Health sample. In a sense, this is somewhat helpful, because a small sample tends to be “unstable”, leading nonsense results and other signs of problems to show up easily – one example would be multivariate coefficients of association (the beta coefficients reported near the arrows) greater than 1 due to collinearity ().

So what does the model above tell us? It tells us that smoking (Smokng) is associated with reduced physical activity (PhysAct); beta = -0.92. It tells us that smoking (Smokng) is associated with reduced food intake (FoodInt); beta = -0.36. It tells us that physical activity (PhysAct) is associated with reduced incidence of diabetes (Diabetes); beta = -0.25. It tells us that increased food intake (FoodInt) is associated with increased incidence of diabetes (Diabetes); beta = 0.93. It tells us that increased food intake (FoodInt) is associated with increased red meat intake (RedMeat); beta = 0.60. It tells us that increased incidence of diabetes (Diabetes) is associated with increased mortality (Mort); beta = 0.61. It tells us that being female (SexM1F2) is associated with reduced mortality (Mort); beta = -0.67.
Some of these betas are a bit too high (e.g., 0.93), due to the level of collinearity caused by such a small sample. Due to being quite high, they are statistically significant even in a small sample. Betas greater than 0.20 tend to become statistically significant when the sample size is 100 or greater; so all of the coefficients above would be statistically significant with a larger sample size. What is the common denominator of all of the associations above? The common denominator is that all of them make sense, qualitatively speaking; there is not a single case where the sign is the opposite of what we would expect. There is one association that is shown on the graph and that is missing from my summary of associations above; and it also makes sense, at least to me. The model also tells us that increased red meat intake (RedMeat) is associated with reduced mortality (Mort); beta = -0.25. More technically, it tells us that, when we control for biological sex (SexM1F2) and incidence of diabetes (Diabetes), increased red meat intake (RedMeat) is associated with reduced mortality (Mort).
How do we roughly estimate this effect in terms of amounts of red meat consumed? The -0.25 means that, for each standard deviation in the amount of red meat consumed, there is a corresponding 0.25 standard deviation reduction of mortality. (This interpretation is possible because I used WarpPLS’ linear analysis algorithm; a nonlinear algorithm would lead to a more complex interpretation.) The standard deviation for red meat consumption is 0.897 servings. Each serving has about 84 g. And the highest number of servings in the dataset is 3.1 servings, or 260 g/d (calculated as: 3.1*84). To stay a bit shy of this extreme, let us consider a slightly lower intake amount, which is 3.1 standard deviations, or 234 g/d (calculated as: 3.1*0.897*84). Since the standard deviation for mortality is 0.3 percentage points, we can conclude that an extra 234 g of red meat per day is associated with a reduction in mortality of approximately 23 percent (calculated as: 3.1*0.25*0.3).
Let me repeat for emphasis: the data reported by the authors suggests that, when we control for biological sex and incidence of diabetes, an extra 234 g of red meat per day is associated with a reduction in mortality of approximately 23 percent. This is exactly the opposite, qualitatively speaking, of what was reported by the authors in the article. I should note that this is also a minute effect, like the effect reported by the authors. (The mortality rates in the article are expressed as percentages, with the lowest being around 1 percent. So this 23 percent is a percentage of a percentage.) If you were to compare a group of 100 people who ate little red meat with another group of the same size that ate 234 g more of red meat every day, over a period of more than 20 years, you would not find a single additional death in either group. If you were to compare matched groups of 1,000 individuals, you would find only 2 additional deaths among the folks who ate little red meat.
At the same time, we can also see that excessive food intake is associated with increased mortality via its effect on diabetes. The product beta coefficient for the mediated effect FoodInt --> Diabetes --> Mort is 0.57. This means that, for each standard deviation of food intake in grams, there is a corresponding 0.57 standard deviation increase in mortality, via an increase in the incidence of diabetes. This is very likely at levels of food consumption where significantly more calories are consumed than spent, ultimately leading to many people becoming obese. The standard deviation for food intake is 355 calories. The highest daily food intake quintile reported in the article is 2,396 calories, which happens to be associated with the highest mortality (and is probably an underestimation); the lowest is 1,202 (also probably underestimated).
So, in summary, the data suggests that, for the particular sample studied (made up of two subsamples): (a) red meat intake is protective in terms of overall mortality, through a direct effect; and (b) the deleterious effect of overeating on mortality is stronger than the protective effect of red meat intake. These conclusions are consistent with those of my previous post on the same study (). The difference is that the previous post suggested a possible moderating protective effect; this post suggests a possible direct protective effect. Both effects are small, as was the negative effect reported by the authors of the study. Neither is statistically significant, due to sample size limitations (secondary data from an article; N=10). And all of this is based on a study that categorized various types of processed meat as red meat, and that did not distinguish grass-fed from non-grass-fed meat.
By the way, in discussions of red meat intake’s effect on health, often iron overload is mentioned. What many people don’t seem to realize is that iron overload is caused primarily by hereditary haemochromatosis. Another cause is “blood doping” to improve athletic performance (). Hereditary haemochromatosis is a very rare genetic disorder; rare enough to be statistically “invisible” in any study that does not specifically target people with this disorder.
So I entered the data reported in the most recent (published online in March 2012) study looking at the relationship between red meat consumption and mortality into WarpPLS to do some exploratory analyses. I discussed the study in my previous post; it was conducted by Pan et al. (Frank B. Hu is the senior author) and published in the prestigious Archives of Internal Medicine (). The data I used is from Table 1 of the article; it reports figures on several variables along 5 quintiles, based on separate analyses of two samples, called “Health Professionals” and “Nurses Health” samples. The Health Professionals sample comprised males; the Nurses Health sample, females.
Below is an interesting exploratory model, with results. It includes a number of hypotheses, represented by arrows, which seem to make sense. This is helpful, because a model incorporating hypotheses that make sense allows for easy identification of nonsense results, and thus rejection of the model or the data. (Refutability is one of the most important characteristics of good theoretical models.) Keep in mind that the sample size here is very small (N=10), as the authors of the study reported data along 5 quintiles for the Health Professionals sample, together with 5 quintiles for the Nurses Health sample. In a sense, this is somewhat helpful, because a small sample tends to be “unstable”, leading nonsense results and other signs of problems to show up easily – one example would be multivariate coefficients of association (the beta coefficients reported near the arrows) greater than 1 due to collinearity ().

So what does the model above tell us? It tells us that smoking (Smokng) is associated with reduced physical activity (PhysAct); beta = -0.92. It tells us that smoking (Smokng) is associated with reduced food intake (FoodInt); beta = -0.36. It tells us that physical activity (PhysAct) is associated with reduced incidence of diabetes (Diabetes); beta = -0.25. It tells us that increased food intake (FoodInt) is associated with increased incidence of diabetes (Diabetes); beta = 0.93. It tells us that increased food intake (FoodInt) is associated with increased red meat intake (RedMeat); beta = 0.60. It tells us that increased incidence of diabetes (Diabetes) is associated with increased mortality (Mort); beta = 0.61. It tells us that being female (SexM1F2) is associated with reduced mortality (Mort); beta = -0.67.
Some of these betas are a bit too high (e.g., 0.93), due to the level of collinearity caused by such a small sample. Due to being quite high, they are statistically significant even in a small sample. Betas greater than 0.20 tend to become statistically significant when the sample size is 100 or greater; so all of the coefficients above would be statistically significant with a larger sample size. What is the common denominator of all of the associations above? The common denominator is that all of them make sense, qualitatively speaking; there is not a single case where the sign is the opposite of what we would expect. There is one association that is shown on the graph and that is missing from my summary of associations above; and it also makes sense, at least to me. The model also tells us that increased red meat intake (RedMeat) is associated with reduced mortality (Mort); beta = -0.25. More technically, it tells us that, when we control for biological sex (SexM1F2) and incidence of diabetes (Diabetes), increased red meat intake (RedMeat) is associated with reduced mortality (Mort).
How do we roughly estimate this effect in terms of amounts of red meat consumed? The -0.25 means that, for each standard deviation in the amount of red meat consumed, there is a corresponding 0.25 standard deviation reduction of mortality. (This interpretation is possible because I used WarpPLS’ linear analysis algorithm; a nonlinear algorithm would lead to a more complex interpretation.) The standard deviation for red meat consumption is 0.897 servings. Each serving has about 84 g. And the highest number of servings in the dataset is 3.1 servings, or 260 g/d (calculated as: 3.1*84). To stay a bit shy of this extreme, let us consider a slightly lower intake amount, which is 3.1 standard deviations, or 234 g/d (calculated as: 3.1*0.897*84). Since the standard deviation for mortality is 0.3 percentage points, we can conclude that an extra 234 g of red meat per day is associated with a reduction in mortality of approximately 23 percent (calculated as: 3.1*0.25*0.3).
Let me repeat for emphasis: the data reported by the authors suggests that, when we control for biological sex and incidence of diabetes, an extra 234 g of red meat per day is associated with a reduction in mortality of approximately 23 percent. This is exactly the opposite, qualitatively speaking, of what was reported by the authors in the article. I should note that this is also a minute effect, like the effect reported by the authors. (The mortality rates in the article are expressed as percentages, with the lowest being around 1 percent. So this 23 percent is a percentage of a percentage.) If you were to compare a group of 100 people who ate little red meat with another group of the same size that ate 234 g more of red meat every day, over a period of more than 20 years, you would not find a single additional death in either group. If you were to compare matched groups of 1,000 individuals, you would find only 2 additional deaths among the folks who ate little red meat.
At the same time, we can also see that excessive food intake is associated with increased mortality via its effect on diabetes. The product beta coefficient for the mediated effect FoodInt --> Diabetes --> Mort is 0.57. This means that, for each standard deviation of food intake in grams, there is a corresponding 0.57 standard deviation increase in mortality, via an increase in the incidence of diabetes. This is very likely at levels of food consumption where significantly more calories are consumed than spent, ultimately leading to many people becoming obese. The standard deviation for food intake is 355 calories. The highest daily food intake quintile reported in the article is 2,396 calories, which happens to be associated with the highest mortality (and is probably an underestimation); the lowest is 1,202 (also probably underestimated).
So, in summary, the data suggests that, for the particular sample studied (made up of two subsamples): (a) red meat intake is protective in terms of overall mortality, through a direct effect; and (b) the deleterious effect of overeating on mortality is stronger than the protective effect of red meat intake. These conclusions are consistent with those of my previous post on the same study (). The difference is that the previous post suggested a possible moderating protective effect; this post suggests a possible direct protective effect. Both effects are small, as was the negative effect reported by the authors of the study. Neither is statistically significant, due to sample size limitations (secondary data from an article; N=10). And all of this is based on a study that categorized various types of processed meat as red meat, and that did not distinguish grass-fed from non-grass-fed meat.
By the way, in discussions of red meat intake’s effect on health, often iron overload is mentioned. What many people don’t seem to realize is that iron overload is caused primarily by hereditary haemochromatosis. Another cause is “blood doping” to improve athletic performance (). Hereditary haemochromatosis is a very rare genetic disorder; rare enough to be statistically “invisible” in any study that does not specifically target people with this disorder.
Saturday, February 4, 2012
An Interview with Dr. C. Vicky Beer, Paleo-friendly MD
As I was preparing my recent article on the Paleo diet (1), I interviewed a local Paleo-friendly MD named C. Vicky Beer. I was only able to include a snippet of the interview in the article, but I thought WHS readers would be interested to read the rest of the interview with Dr. Beer:
Read more »
Read more »
Monday, January 23, 2012
What Causes Insulin Resistance? Part VII
In previous posts, I outlined the factors I'm aware of that can contribute to insulin resistance. In this post, first I'll list the factors, then I'll provide my opinion of effective strategies for preventing and potentially reversing insulin resistance.
The factors
These are the factors I'm aware of that can contribute to insulin resistance, listed in approximate order of importance. I could be quite wrong about the order-- this is just my best guess. Many of these factors are intertwined with one another.
Read more »
The factors
These are the factors I'm aware of that can contribute to insulin resistance, listed in approximate order of importance. I could be quite wrong about the order-- this is just my best guess. Many of these factors are intertwined with one another.
Read more »
Wednesday, January 18, 2012
What Causes Insulin Resistance? Part VI
In this post, I'll explore a few miscellaneous factors that can contribute to insulin resistance: smoking, glucocorticoids/stress, cooking temperature, age, genetics and low birth weight.
Smoking
Smoking tobacco acutely and chronically reduces insulin sensitivity (1, 2, 3), possibly via:
Read more »
Smoking
Smoking tobacco acutely and chronically reduces insulin sensitivity (1, 2, 3), possibly via:
- Increased inflammation
- Increased circulating free fatty acids (4)
Read more »
Sunday, January 15, 2012
What Causes Insulin Resistance? Part V
Previously in this series, we've discussed the role of cellular energy excess, inflammation, brain insulin resistance, and micronutrient status in insulin resistance. In this post, I'll explore the role of macronutrients and sugar in insulin sensitivity.
Carbohydrate and Fat
There are a number of studies on the effect of carbohydrate:fat ratios on insulin sensitivity, but many of them are confounded by fat loss (e.g., low-carbohydrate and low-fat weight loss studies), which almost invariably improves insulin sensitivity. What interests me the most is to understand what effect different carbohydrate:fat ratios have on insulin sensitivity in healthy, weight stable people. This will get at what causes insulin resistance in someone who does not already have it.
Read more »
Carbohydrate and Fat
There are a number of studies on the effect of carbohydrate:fat ratios on insulin sensitivity, but many of them are confounded by fat loss (e.g., low-carbohydrate and low-fat weight loss studies), which almost invariably improves insulin sensitivity. What interests me the most is to understand what effect different carbohydrate:fat ratios have on insulin sensitivity in healthy, weight stable people. This will get at what causes insulin resistance in someone who does not already have it.
Read more »
Monday, January 9, 2012
What Causes Insulin Resistance? Part IV
So far, we've explored three interlinked causes of insulin resistance: cellular energy excess, inflammation, and insulin resistance in the brain. In this post, I'll explore the effects on micronutrient status on insulin sensitivity.
Micronutrient Status
There is a large body of literature on the effects of nutrient intake/status on insulin action, and it's not my field, so I don't intend this to be a comprehensive post. My intention is simply to demonstrate that it's important, and highlight a few major factors I'm aware of.
Read more »
Micronutrient Status
There is a large body of literature on the effects of nutrient intake/status on insulin action, and it's not my field, so I don't intend this to be a comprehensive post. My intention is simply to demonstrate that it's important, and highlight a few major factors I'm aware of.
Read more »
Sunday, January 8, 2012
What Causes Insulin Resistance? Part III
As discussed in previous posts, cellular energy excess and inflammation are two important and interlinked causes of insulin resistance. Continuing our exploration of insulin resistance, let's turn our attention to the brain.
The brain influences every tissue in the body, in many instances managing tissue processes to react to changing environmental or internal conditions. It is intimately involved in insulin signaling in various tissues, for example by:
Read more »
The brain influences every tissue in the body, in many instances managing tissue processes to react to changing environmental or internal conditions. It is intimately involved in insulin signaling in various tissues, for example by:
- regulating insulin secretion by the pancreas (1)
- regulating glucose absorption by tissues in response to insulin (2)
- regulating the suppression of glucose production by the liver in response to insulin (3)
- regulating the trafficking of fatty acids in and out of fat cells in response to insulin (4, 5)
Read more »
Saturday, January 7, 2012
What Causes Insulin Resistance? Part II
In the last post, I described how cellular energy excess causes insulin resistance, and how this is triggered by whole-body energy imbalance. In this post, I'll describe another major cause of insulin resistance: inflammation.
Inflammation
In 1876, a German physician named W Ebstein reported that high doses of sodium salicylate could totally eliminate the signs and symptoms of diabetes in certain patients (Berliner Klinische Wochenschrift. 13:337. 1876). Following up on this work in 1901, the British physician RT Williamson reported that treating diabetic patients with sodium salicylate caused a striking decrease in the amount of glucose contained in the patients' urine, also indicating an apparent improvement in diabetes (2). This effect was essentially forgotten until 1957, when it was rediscovered.
Read more »
Inflammation
In 1876, a German physician named W Ebstein reported that high doses of sodium salicylate could totally eliminate the signs and symptoms of diabetes in certain patients (Berliner Klinische Wochenschrift. 13:337. 1876). Following up on this work in 1901, the British physician RT Williamson reported that treating diabetic patients with sodium salicylate caused a striking decrease in the amount of glucose contained in the patients' urine, also indicating an apparent improvement in diabetes (2). This effect was essentially forgotten until 1957, when it was rediscovered.
Read more »
Friday, January 6, 2012
What Causes Insulin Resistance? Part I
Insulin is an ancient hormone that influences many processes in the body. Its main role is to manage circulating concentrations of nutrients (principally glucose and fatty acids, the body's two main fuels), keeping them within a fairly narrow range*. It does this by encouraging the transport of nutrients into cells from the circulation, and discouraging the export of nutrients out of storage sites, in response to an increase in circulating nutrients (glucose or fatty acids). It therefore operates a negative feedback loop that constrains circulating nutrient concentrations. It also has many other functions that are tissue-specific.
Insulin resistance is a state in which cells lose sensitivity to the effects of insulin, eventually leading to a diminished ability to control circulating nutrients (glucose and fatty acids). It is a major contributor to diabetes risk, and probably a contributor to the risk of cardiovascular disease, certain cancers and a number of other disorders.
Why is it important to manage the concentration of circulating nutrients to keep them within a narrow range? The answer to that question is the crux of this post.
Read more »
Insulin resistance is a state in which cells lose sensitivity to the effects of insulin, eventually leading to a diminished ability to control circulating nutrients (glucose and fatty acids). It is a major contributor to diabetes risk, and probably a contributor to the risk of cardiovascular disease, certain cancers and a number of other disorders.
Why is it important to manage the concentration of circulating nutrients to keep them within a narrow range? The answer to that question is the crux of this post.
Read more »
Friday, October 28, 2011
The Brain Controls Insulin Action
Insulin regulates blood glucose primarily by two mechanisms:
Read more »
- Suppressing glucose production by the liver
- Enhancing glucose uptake by other tissues, particularly muscle and liver
Read more »
Monday, October 17, 2011
Book review: Perfect Health Diet
Perfect Health Diet is a book that one should own. It is not the type of book that you can get from your local library and just do a quick read over (and, maybe, write a review about it). If you do that, you will probably miss several important ideas that form the foundation of this book, which is a deep foundation.
The book is titled “Perfect Health Diet”, not “The Perfect Health Diet”. If you think that this is a mistake, consider that the most successful social networking web site of all time started as “The Facebook”, and then changed to simply “Facebook”; which was perceived later as a major improvement.
Moreover, “Perfect Health Diet” makes for a cool and not at all inappropriate acronym – “PHD”.
What people eat has an enormous influence on their lives, and also on the lives of those around them. Nutrition is clearly one of the most important topics in the modern world - it is the source of much happiness and suffering for entire populations. If Albert Einstein and Marie Curie were alive today, they would probably be interested in nutrition, as they were about important topics of their time that were outside their main disciplines and research areas (e.g., the consequences of war, and future war deterrence).
Nutrition attracts the interest of many bright people today. Those who are not professional nutrition researchers often fund their own research, spending hours and hours of their own time studying the literature and even experimenting on themselves. Several of them decide to think deeply and carefully about it. A few, like Paul Jaminet and Shou-Ching Jaminet, decide to write about it, and all of us benefit from their effort.
The Jaminets have PhDs (not copies of their books, degrees). Their main PhD disciplines are somewhat similar to Einstein’s and Curie’s; which is an interesting coincidence. What the Jaminets have written about nutrition is probably analogous, in broad terms, to what Einstein and Curie would have written about nutrition if they were alive today. They would have written about a “unified field theory” of nutrition, informed by chemistry.
To put it simply, the main idea behind this book is to find the “sweet spot” for each major macronutrient (e.g., protein and fat) and micronutrient (e.g., vitamins and minerals) that is important for humans. The sweet spot is the area indicated on the graph below. This is my own simplified interpretation of the authors' more complex graphs on marginal benefits from nutrients.

The book provides detailed information about each of the major nutrients that are important to humans, what their “sweet spot” levels are, and how to obtain them. In this respect the book is very thorough, and also very clear, including plenty of good arguments and empirical research results to back up the recommendations. But this book is much more than that.
Why do I refer to this book as proposing a “unified field theory” of nutrition? The reason is that this book clearly aims at unifying all of the current state of the art knowledge about nutrition, departing from a few fundamental ideas.
One of those fundamental ideas is that a good diet would provide nutrients in the same ratio as those provided by our own tissues when we “cannibalize” them – i.e., when we fast. Another is that human breast milk is a good basis for the estimation of the ratios of macronutrients a human adult would need for optimal health.
And here is where the depth and brilliance with which the authors address these issues can lead to misunderstandings.
For example, when our body “cannibalizes” itself (e.g., at the 16-h mark of a water fast), there is no digestion going on. And, as the authors point out, what you eat, in terms of nutrients, is often not what you get after digestion. It may surprise many to know that a diet rich in vegetables is actually a high fat diet (if you are surprised, you should read the book). One needs to keep these things in mind to understand that not all dietary macronutrient ratios will lead to the same ratios of nutrients after digestion, and that the dietary equivalent of “cannibalizing” oneself is not a beef-only diet.
Another example relates to the issue of human breast milk. Many seem to have misunderstood the authors as implying that the macronutrient ratios in human breast milk are optimal for adult humans. The authors say nothing of the kind. What they do is to use human breast milk as a basis for their estimation of what an adult human should get, based on a few reasonable assumptions. One of the assumptions is that a human adult’s brain consumes proportionally much less sugar than an infant’s.
Yet another example is the idea of “safe starches”, which many seem to have taken as a recommendation that diabetics should eat lots of white rice and potato. The authors have never said such a thing in the book; not even close. "Safe starches", like white rice and sweet potatoes (as well as white potatoes), are presented in the book as good sources of carbohydrates that are also generally free from harmful plant toxins. And they are, if consumed after cooking.
By the way, I have a colleague who has type 2 diabetes and can eat meat with white potatoes without experiencing hyperglycemia, as long as the amount of potato is very small and is eaten after a few bites of meat.
Do I disagree with some of the things that the authors say? Sure I do, but not in a way that would lead to significantly different dietary recommendations. And, who knows, maybe I am wrong.
For example, the authors seem to think that dietary advanced glycation end-products (AGEs) can be a problem for humans, and therefore recommend that you avoid cooking meat at high temperatures (no barbecuing, for example). I have not found any convincing evidence that this is true in healthy people, but following the authors’ advice will not hurt you at all. And if your digestive tract is compromised to the point that undigested food particles are entering your bloodstream, then maybe you should avoid dietary sources of AGEs.
Also, I think that humans tend to adapt to different macronutrient ratios in more fundamental ways than the authors seem to believe they can. These adaptations are long-term ones, and are better understood based on the notion of compensatory adaptation. For instance, a very low carbohydrate diet may bring about some problems in the short term, but long-term adaptations may reverse those problems, without a change in the diet.
The authors should be careful about small errors that may give a bad impression to some experts, and open them up to undue criticism; as experts tend to be very picky and frequently generalize based on small errors. Here is one. The authors seem to imply that eating coconut oil will help feed colon cells, which indeed seem to feed on short-chain fats; not exactly the medium-chain fats abundantly found in coconut oil, but okay. (This may be the main reason why indigestible fiber contributes to colon health, by being converted by bacteria to short-chain fats.) The main problem with the authors' implied claim is that coconut oil, as a fat, will be absorbed in the small intestine, and thus will not reach colon cells in any significant amounts.
Finally, I don’t think that increased animal protein consumption causes decreased longevity; an idea that the authors seem to lean toward. One reason is that seafood consumption is almost universally associated with increased longevity, even when it is heavily consumed, and seafood in general has a very high protein-to-fat ratio (much higher than beef). The connection between high animal protein consumption and decreased longevity suggested by many studies, some of which are cited in the book, is unlikely to be due to the protein itself, in my opinion. That connection is more likely to be due to some patterns that may be associated in certain populations with animal protein consumption (e.g., refined wheat and industrial seed oils consumption).
Thankfully, controversial issues and small errors can be easily addressed online. The authors maintain a popular blog, and they do so in such a way that the blog is truly an extension of the book. This blog is one of my favorites. Perhaps we will see some of the above issues addressed in the blog.
All in all, this seems like a bargain to me. For about 25 bucks (less than that, if you trade in quid; and more, if you do in Yuan), and with some self-determination, you may save thousands of dollars in medical bills. More importantly, you may change your life, and those of the ones around you, for the better.
The book is titled “Perfect Health Diet”, not “The Perfect Health Diet”. If you think that this is a mistake, consider that the most successful social networking web site of all time started as “The Facebook”, and then changed to simply “Facebook”; which was perceived later as a major improvement.
Moreover, “Perfect Health Diet” makes for a cool and not at all inappropriate acronym – “PHD”.
What people eat has an enormous influence on their lives, and also on the lives of those around them. Nutrition is clearly one of the most important topics in the modern world - it is the source of much happiness and suffering for entire populations. If Albert Einstein and Marie Curie were alive today, they would probably be interested in nutrition, as they were about important topics of their time that were outside their main disciplines and research areas (e.g., the consequences of war, and future war deterrence).
Nutrition attracts the interest of many bright people today. Those who are not professional nutrition researchers often fund their own research, spending hours and hours of their own time studying the literature and even experimenting on themselves. Several of them decide to think deeply and carefully about it. A few, like Paul Jaminet and Shou-Ching Jaminet, decide to write about it, and all of us benefit from their effort.
The Jaminets have PhDs (not copies of their books, degrees). Their main PhD disciplines are somewhat similar to Einstein’s and Curie’s; which is an interesting coincidence. What the Jaminets have written about nutrition is probably analogous, in broad terms, to what Einstein and Curie would have written about nutrition if they were alive today. They would have written about a “unified field theory” of nutrition, informed by chemistry.
To put it simply, the main idea behind this book is to find the “sweet spot” for each major macronutrient (e.g., protein and fat) and micronutrient (e.g., vitamins and minerals) that is important for humans. The sweet spot is the area indicated on the graph below. This is my own simplified interpretation of the authors' more complex graphs on marginal benefits from nutrients.

The book provides detailed information about each of the major nutrients that are important to humans, what their “sweet spot” levels are, and how to obtain them. In this respect the book is very thorough, and also very clear, including plenty of good arguments and empirical research results to back up the recommendations. But this book is much more than that.
Why do I refer to this book as proposing a “unified field theory” of nutrition? The reason is that this book clearly aims at unifying all of the current state of the art knowledge about nutrition, departing from a few fundamental ideas.
One of those fundamental ideas is that a good diet would provide nutrients in the same ratio as those provided by our own tissues when we “cannibalize” them – i.e., when we fast. Another is that human breast milk is a good basis for the estimation of the ratios of macronutrients a human adult would need for optimal health.
And here is where the depth and brilliance with which the authors address these issues can lead to misunderstandings.
For example, when our body “cannibalizes” itself (e.g., at the 16-h mark of a water fast), there is no digestion going on. And, as the authors point out, what you eat, in terms of nutrients, is often not what you get after digestion. It may surprise many to know that a diet rich in vegetables is actually a high fat diet (if you are surprised, you should read the book). One needs to keep these things in mind to understand that not all dietary macronutrient ratios will lead to the same ratios of nutrients after digestion, and that the dietary equivalent of “cannibalizing” oneself is not a beef-only diet.
Another example relates to the issue of human breast milk. Many seem to have misunderstood the authors as implying that the macronutrient ratios in human breast milk are optimal for adult humans. The authors say nothing of the kind. What they do is to use human breast milk as a basis for their estimation of what an adult human should get, based on a few reasonable assumptions. One of the assumptions is that a human adult’s brain consumes proportionally much less sugar than an infant’s.
Yet another example is the idea of “safe starches”, which many seem to have taken as a recommendation that diabetics should eat lots of white rice and potato. The authors have never said such a thing in the book; not even close. "Safe starches", like white rice and sweet potatoes (as well as white potatoes), are presented in the book as good sources of carbohydrates that are also generally free from harmful plant toxins. And they are, if consumed after cooking.
By the way, I have a colleague who has type 2 diabetes and can eat meat with white potatoes without experiencing hyperglycemia, as long as the amount of potato is very small and is eaten after a few bites of meat.
Do I disagree with some of the things that the authors say? Sure I do, but not in a way that would lead to significantly different dietary recommendations. And, who knows, maybe I am wrong.
For example, the authors seem to think that dietary advanced glycation end-products (AGEs) can be a problem for humans, and therefore recommend that you avoid cooking meat at high temperatures (no barbecuing, for example). I have not found any convincing evidence that this is true in healthy people, but following the authors’ advice will not hurt you at all. And if your digestive tract is compromised to the point that undigested food particles are entering your bloodstream, then maybe you should avoid dietary sources of AGEs.
Also, I think that humans tend to adapt to different macronutrient ratios in more fundamental ways than the authors seem to believe they can. These adaptations are long-term ones, and are better understood based on the notion of compensatory adaptation. For instance, a very low carbohydrate diet may bring about some problems in the short term, but long-term adaptations may reverse those problems, without a change in the diet.
The authors should be careful about small errors that may give a bad impression to some experts, and open them up to undue criticism; as experts tend to be very picky and frequently generalize based on small errors. Here is one. The authors seem to imply that eating coconut oil will help feed colon cells, which indeed seem to feed on short-chain fats; not exactly the medium-chain fats abundantly found in coconut oil, but okay. (This may be the main reason why indigestible fiber contributes to colon health, by being converted by bacteria to short-chain fats.) The main problem with the authors' implied claim is that coconut oil, as a fat, will be absorbed in the small intestine, and thus will not reach colon cells in any significant amounts.
Finally, I don’t think that increased animal protein consumption causes decreased longevity; an idea that the authors seem to lean toward. One reason is that seafood consumption is almost universally associated with increased longevity, even when it is heavily consumed, and seafood in general has a very high protein-to-fat ratio (much higher than beef). The connection between high animal protein consumption and decreased longevity suggested by many studies, some of which are cited in the book, is unlikely to be due to the protein itself, in my opinion. That connection is more likely to be due to some patterns that may be associated in certain populations with animal protein consumption (e.g., refined wheat and industrial seed oils consumption).
Thankfully, controversial issues and small errors can be easily addressed online. The authors maintain a popular blog, and they do so in such a way that the blog is truly an extension of the book. This blog is one of my favorites. Perhaps we will see some of the above issues addressed in the blog.
All in all, this seems like a bargain to me. For about 25 bucks (less than that, if you trade in quid; and more, if you do in Yuan), and with some self-determination, you may save thousands of dollars in medical bills. More importantly, you may change your life, and those of the ones around you, for the better.
Monday, September 19, 2011
Being glucose intolerant may make you live only to be 96, if you would otherwise live to be 100
This comes also from the widely cited Brunner and colleagues study, published in Diabetes Care in 2006. They defined a person as glucose intolerant if he or she had a blood glucose level of 5.3-11 mmol/l after a 2-h post–50-g oral glucose tolerance test. For those using the other measurement system, like us here in the USA, that is a blood glucose level of approximately 95-198 mg/dl.
Quite a range, eh!? This covers the high end of normoglycemia, as well as pre- to full-blown type 2 diabetes.
In this investigation, called the Whitehall Study, 18,403 nonindustrial London-based male civil servants aged 40 to 64 years were examined between September 1967 and January 1970. These folks were then followed for over 30 years, based on the National Health Service Central Registry; essentially to find out whether they had died, and of what. During this period, there were 11,426 deaths from all causes; with 5,497 due to cardiovascular disease (48.1%) and 3,240 due to cancer (28.4%).
The graph below shows the age-adjusted survival rates against time after diagnosis. Presumably the N values refer to the individuals in the glucose intolerant (GI) and type 2 diabetic (T2DM) groups that were alive at the end of the monitoring period. This does not apply to the normoglycemic N value; this value seems to refer to the number of normoglycemic folks alive after the divergence point (5-10 years from diagnosis).

Note by the authors: “Survival by baseline glucose tolerance status diverged after 5-10 years of follow-up. Median survival differed by 4 years between the normoglycemic and glucose intolerant groups and was 10 years less in the diabetic compared with the glucose intolerant group.”
That is, it took between 5 and 10 years of high blood glucose levels for any effect on mortality to be noticed. One would expect at least some of the diagnosed folks to have done something about their blood glucose levels; a confounder that was not properly controlled for in this study, as far as I can tell. The glucose intolerant folks ended up living 4 years less than the normoglycemics, and 10 years more than the diabetics.
One implication of this article is that perhaps you should not worry too much if you experience a temporary increase in blood glucose levels due to compensatory adaptation to healthy changes in diet and lifestyle, such as elevated growth hormone levels. It seems unlikely that such temporary increase in blood glucose levels, even if lasting as much as 1 year, will lead to permanent damage to cells involved in glucose metabolism like the beta cells in the pancreas.
Another implication is that being diagnosed as pre-diabetic or diabetic is not a death sentence, as some people seem to take such diagnoses at first. Many of the folks in this study who decided to do something about their health following an adverse diagnosis probably followed the traditional advice for the treatment of pre-diabetes and diabetes, which likely made their health worse. (See Jeff O’Connell’s book Sugar Nation for a detailed discussion of what that advice entails.) And still, not everyone progressed from pre-diabetes to full-blow diabetes. Probably fewer refined foods available helped, but this does not fully explain the lack of progression to full-blow diabetes.
It is important to note that this study was conducted in the late 1960s. Biosynthetic insulin was developed in the 1970s using recombinant DNA techniques, and was thus largely unavailable to the participants of this study. Other treatment options were also largely unavailable. Arguably the most influential book on low carbohydrate dieting, by Dr. Atkins, was published in the early 1970s. The targeted use of low carbohydrate dieting for blood glucose control in diabetics was not widely promoted until the 1980s, and even today it is not adopted by mainstream diabetes doctors. To this I should add that, at least anecdotally and from living in an area where diabetes is an epidemic (South Texas), those people who carefully control their blood sugars after type 2 diabetes diagnoses, in many cases with the help of drugs, seem to see marked and sustained health improvements.
Finally, an interesting implication of this study is that glucose intolerance, as defined in the article, would probably not do much to change an outside observer’s perception of a long-living population. That is, if you take a population whose individuals are predisposed to live long lives, with many naturally becoming centenarians, they will likely still be living long lives even if glucose intolerance is rampant. Without carefully conducted glucose tolerance tests, an outside observer may conclude that a damaging diet is actually healthy by still finding many long-living individuals in a population consuming that diet.
Quite a range, eh!? This covers the high end of normoglycemia, as well as pre- to full-blown type 2 diabetes.
In this investigation, called the Whitehall Study, 18,403 nonindustrial London-based male civil servants aged 40 to 64 years were examined between September 1967 and January 1970. These folks were then followed for over 30 years, based on the National Health Service Central Registry; essentially to find out whether they had died, and of what. During this period, there were 11,426 deaths from all causes; with 5,497 due to cardiovascular disease (48.1%) and 3,240 due to cancer (28.4%).
The graph below shows the age-adjusted survival rates against time after diagnosis. Presumably the N values refer to the individuals in the glucose intolerant (GI) and type 2 diabetic (T2DM) groups that were alive at the end of the monitoring period. This does not apply to the normoglycemic N value; this value seems to refer to the number of normoglycemic folks alive after the divergence point (5-10 years from diagnosis).

Note by the authors: “Survival by baseline glucose tolerance status diverged after 5-10 years of follow-up. Median survival differed by 4 years between the normoglycemic and glucose intolerant groups and was 10 years less in the diabetic compared with the glucose intolerant group.”
That is, it took between 5 and 10 years of high blood glucose levels for any effect on mortality to be noticed. One would expect at least some of the diagnosed folks to have done something about their blood glucose levels; a confounder that was not properly controlled for in this study, as far as I can tell. The glucose intolerant folks ended up living 4 years less than the normoglycemics, and 10 years more than the diabetics.
One implication of this article is that perhaps you should not worry too much if you experience a temporary increase in blood glucose levels due to compensatory adaptation to healthy changes in diet and lifestyle, such as elevated growth hormone levels. It seems unlikely that such temporary increase in blood glucose levels, even if lasting as much as 1 year, will lead to permanent damage to cells involved in glucose metabolism like the beta cells in the pancreas.
Another implication is that being diagnosed as pre-diabetic or diabetic is not a death sentence, as some people seem to take such diagnoses at first. Many of the folks in this study who decided to do something about their health following an adverse diagnosis probably followed the traditional advice for the treatment of pre-diabetes and diabetes, which likely made their health worse. (See Jeff O’Connell’s book Sugar Nation for a detailed discussion of what that advice entails.) And still, not everyone progressed from pre-diabetes to full-blow diabetes. Probably fewer refined foods available helped, but this does not fully explain the lack of progression to full-blow diabetes.
It is important to note that this study was conducted in the late 1960s. Biosynthetic insulin was developed in the 1970s using recombinant DNA techniques, and was thus largely unavailable to the participants of this study. Other treatment options were also largely unavailable. Arguably the most influential book on low carbohydrate dieting, by Dr. Atkins, was published in the early 1970s. The targeted use of low carbohydrate dieting for blood glucose control in diabetics was not widely promoted until the 1980s, and even today it is not adopted by mainstream diabetes doctors. To this I should add that, at least anecdotally and from living in an area where diabetes is an epidemic (South Texas), those people who carefully control their blood sugars after type 2 diabetes diagnoses, in many cases with the help of drugs, seem to see marked and sustained health improvements.
Finally, an interesting implication of this study is that glucose intolerance, as defined in the article, would probably not do much to change an outside observer’s perception of a long-living population. That is, if you take a population whose individuals are predisposed to live long lives, with many naturally becoming centenarians, they will likely still be living long lives even if glucose intolerance is rampant. Without carefully conducted glucose tolerance tests, an outside observer may conclude that a damaging diet is actually healthy by still finding many long-living individuals in a population consuming that diet.
Subscribe to:
Posts (Atom)