Tuesday, December 29, 2009

The Body Fat Setpoint

One pound of human fat contains about 3,500 calories. That represents roughly 40 slices of toast. So if you were to eat one extra slice of toast every day, you would gain just under a pound of fat per month. Conversely, if you were to eat one fewer slice per day, you'd lose a pound a month. Right? Not quite.

How is it that most peoples' body fat mass stays relatively stable over long periods of time, when an imbalance of as little as 5% of calories should lead to rapid changes in weight? Is it because we do complicated calculations in our heads every day, factoring in basal metabolic rate and exercise, to make sure our energy intake precisely matches expenditure? Of course not. We're gifted with a sophisticated system of hormones and brain regions that do the "calculations" for us unconsciously*.

When it's working properly, this system precisely matches energy intake to expenditure, ensuring a stable and healthy fat mass. It does this by controlling food seeking behaviors, feelings of fullness and even energy expenditure by heat production and physical movements. If you eat a little bit more than usual at a meal, a properly functioning system will say "let's eat a little bit less next time, and perhaps also burn some of it off." This is one reason why animals in their natural habitat are nearly always at an appropriate weight, barring starvation. The only time wild animals are overweight enough to significantly compromise physical performance is when it serves an important purpose, such as preparing for hibernation.

I recently came across a classic study that illustrates these principles nicely in humans, titled "Metabolic Response to Experimental Overfeeding in Lean and Overweight Healthy Volunteers", by Dr. Erik O. Diaz and colleagues (1). They overfed lean and modestly overweight volunteers 50% more calories than they naturally consume, under controlled conditions where the investigators could be confident of food intake. Macronutrient composition was 12-42-46 % protein-fat-carbohydrate.

After 6 weeks of massive overfeeding, both lean and overweight subjects gained an average of 10 lb (4.6 kg) of fat mass and 6.6 lb (3 kg) of lean mass. Consistent with what one would expect if the body were trying to burn off excess calories and return to baseline fat mass, the metabolic rate and body heat production of the subjects increased.

Following overfeeding, subjects were allowed to eat however much they wanted for 6 weeks. Both lean and overweight volunteers promptly lost 6.2 of the 10 lb they had gained in fat mass (61% of fat gained), and 1.5 of the 6.6 lb they had gained in lean mass (23%). Here is a graph showing changes in fat mass for each individual that completed the study:

We don't know if they would have lost the remaining fat mass in the following weeks because they were only followed for 6 weeks after overfeeding, although it did appear that they were reaching a plateau slightly above their original body weight. Thus, nearly all subjects "defended" their original body fat mass irrespective of their starting point. Underfeeding studies have shown the same phenomenon: whether lean or overweight, people tend to return to their original fat mass after underfeeding is over. Again, this supports the idea that the body has a body fat mass "set point" that it attempts to defend against changes in either direction. It's one of many systems in the body that attempt to maintain homeostasis.

OK, so why do we care?

We care because this has some very important implications for human obesity. With such a system in place to keep body fat mass in a narrow range, a major departure from that range implies that the system isn't functioning correctly. In other words, obesity has to involve a defect in the system that regulates body fat, because a properly functioning system would not have allowed that degree of fat gain in the first place.

So yes, we are overweight because we eat too many calories relative to energy expended. But why are we eating too many calories? There are a number of reasons, but one reason is that the system that should be defending a low fat mass is now defending a high fat mass. Therefore, the ideal solution is not simply to restrict calories, or burn more calories through exercise, but to try to work with the system that decides what fat mass to 'defend'. Restricting calories isn't necessarily a good solution because the body will attempt to defend its setpoint, whether high or low, by increasing hunger and decreasing its metabolic rate. That's why low-calorie diets, and most diets in general, typically fail in the long term. Restricting calories works for fat loss, but most people find it miserable to fight hunger every day.

This raises two questions:
  1. What caused the system to defend a high fat mass?
  2. Is it possible to modify the fat mass setpoint, and how would one go about it?
Given the fact that body fat mass is much higher in many affluent nations than it has ever been in human history, the increase must be due to factors that have changed in modern times. I can only speculate what these factors may be, because research has not identified them to my knowledge, at least not in humans. But I have my guesses. I'll expand on this in the next post.


* The hormone leptin and the hypothalamus are the ringleaders, although there are many other elements involved, such as several gut-derived peptides, insulin, and a number of other brain regions.

Friday, December 25, 2009

Rabbits on a High-Saturated Fat Diet Without Added Cholesterol

I just saw another study that supports my previous post Animal Models of Atherosclerosis: LDL. The hypothesis is that in the absence of excessive added dietary cholesterol, saturated fat does not influence LDL or atherosclerosis in animal models, relative to other fats (although omega-6 polyunsaturated oils do lower LDL in some animal models). This appears to be consistent with what we see in humans.

In this study, they fed four groups of rabbits different diets:
  1. Regular low-fat rabbit chow
  2. Regular low-fat rabbit chow plus 0.5 g cholesterol per day
  3. High-fat diet with 30% calories as coconut oil (saturated) and no added cholesterol
  4. High-fat diet with 30% calories as sunflower oil (polyunsaturated) and no added cholesterol
LDL at 6 months was the same in groups 1, 3 and 4, but was increased more than 20-fold in group 2. It's not the fat, it's the fact that they're overloading herbivores with dietary cholesterol!

Total cholesterol was also the same between all groups except the cholesterol-fed group. TBARS, a measure of lipid oxidation in the blood, was elevated in the cholesterol and sunflower oil groups but not in the chow or coconut groups. Oxidation of blood lipids is one of the major factors in atherosclerosis, the vascular disease that narrows arteries and increases the risk of having a heart attack. Serum vitamin C was lower in the cholesterol-fed groups but not the others.

This supports the idea that saturated fat in the absence of excess dietary cholesterol does not necessarily increase LDL, and in fact in most animals it does not.

Merry Christmas!

Thursday, December 24, 2009

Growth hormone: The fountain of youth

Growth hormone, also known as human growth hormone, seems to be implicated in a number of metabolic conditions associated with aging, and, more generally, poor health.

In adults, growth hormone deficiency is associated with: decreased calcium retention and osteoporosis, loss of muscle mass, increased fat deposition, decreased protein synthesis, and immunodeficiency. In children, growth hormone deficiency is associated with stunted growth.

Levels of growth hormones decline with age, and their decrease is believed to contribute to the aging process. Abdominal obesity is associated with low levels of growth hormone, and is also associated with the onset of the metabolic syndrome, a precursor of diabetes and cardiovascular disease.

While there are many treatments in the market that include exogenous administration of growth hormones (e.g., through injection), there are several natural ways in which growth hormone levels can be increased. These natural ways can often lead to more effective and sustainable results than prescription drugs.

For example, fasting stimulates the natural production of growth hormone. So does vigorous exercise, particularly resistance exercise with a strong anaerobic component (not cardio though). And, to the surprise of many people, deep sleep stimulates the natural production of growth hormone, perhaps more than anything else. (Although only once every 24 hours; sleeping all day does not seem to work.)

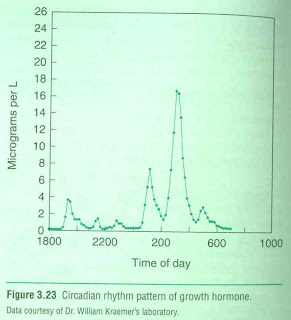
In fact, during a 24-hour period, growth hormone typically varies in pulses, or cycles. The pulses are somewhat uniformly distributed during the day, with a peak occurring at night. The graph below (source: Fleck & Kraemer, 2004) plots the typical variation of growth hormone during a 12-hour period, including the deep sleep period.


As you can see, growth hormone peaks during deep sleep; which is achieved a few hours after one goes to bed, and not too long before one wakes up.

By the way, if you want to know more about human physiology and metabolism, forget about popular diet and exercise books. Next to peer-reviewed academic articles (which are often hard to read), the best sources are college textbooks used in courses on physical education, nutrition, endocrinology, and related topics. The book from which the graph above was taken (Fleck & Kraemer, 2004), is a superb example of that.

Reference:

Fleck, S.J., & Kraemer, W.J. (2004). Designing resistance training programs. Champaign, IL: Human Kinetics.

Wednesday, December 23, 2009

Half-hearted Atkins diet and cardiovascular disease

I would like to comment on a recent article comparing the Atkins, Ornish and South Beach diets (Miller et al., 2009; full reference at the end of this posting), which has been causing quite a lot of commotion among bloggers recently. Especially low carb. bloggers.

An excellent post by Michael Eades clarifies a number of issues with the study, including what one could argue is the study's main flaw. Apparently the study compared a half-hearted Atkins diet, with probably equally half-hearted Ornish and South Beach diets.

I refer to the study's Atkins diet as half-hearted because it seems to rely on a daily consumption of between 120 and 180 grams of carbohydrates. This is unlikely to lead to ketosis, the cornerstone of the Atkins diet, where the body uses ketone bodies (made from dietary as well as body fat) as a source of energy.

As I see it, the main findings of the study were that the participants in the half-hearted Atkins diet, after a period of 4 weeks on the diet, and when compared with the participants in the other diets, had: (a) greater levels of total cholesterol and LDL cholesterol, with only a small improvement in their HDL cholesterol and triglycerides levels; and (b) greater levels of markers for inflammation (e.g., C-reactive protein).

The participants were young and healthy. Their average age was 30.6 years, and their average body mass index was 22.6. On average, their total cholesterol was 184.9 mg/dL, triglycerides were 78.1 mg/dL, LDL cholesterol was 107.2 mg/dL, and HDL cholesterol was 62.2 mg/dL. These are arguably fairly healthy numbers; although quite a few doctors might want to put most of these folks preventively on statins because of their LDL being greater than 100.

What I find interesting about this study, and consistent with both my own experience and also a theory that I have, is that it suggests that a low carb. diet has to really be low carb. in order to bring about the benefits that one normally sees as a result of a diet that induces ketosis. A diet with, say, > 150 g of refined grains per day, is not really a low carb. diet.

Again, in my experience, and that of many other people, a truly low carb. diet (very low in, if not devoid of, refined carbs and sugars), will lead to an impressive increase in HDL cholesterol (especially for those who have low HDL to start with), an equally impressive decrease in triglycerides, increased insulin sensitivity, and possibly a decrease in LDL.

However, a half-hearted Atkins diet may actually lead to elevated LDL (of the small-dense type), and more inflammation, just like this study suggests it does, without the benefits regarding HDL and trigs. The reason is that the still relatively high level of carbohydrate intake, especially if it comes in the form of refined carbs. and sugars, will lead to higher levels of insulin being secreted into the bloodstream. This will promote increased body fat deposition. The extra saturated fat being consumed will be turned into body fat, and not used as energy, starving the cells and leading to increased hunger.

A diet rich in saturated fat may indeed be bad when it is also a diet even moderately rich in insulin-boosting, easily digestible carbs. This may be one of the main reasons why there have been so many studies in the past showing a correlation between saturated fat consumption and heart disease; studies that typically did not control for carbohydrate consumption.

In a recent interview on the Livin' La Vida Low-Carb Blog, Dr. John Salerno goes into more detail regarding this issue, recommending a much more rigid adoption of the Atkins diet than many think is okay. (In fact, I often talk to people who think that if they cut a very high carb. intake in half - e.g., from 400 to 200 grams per day - replacing the carbs with fat, they will be halfway into a full blown Atkins diet.) Dr. Salerno has worked in the past with Dr. Atkins. He calls his diet the Silver Cloud Diet. I am not sure I agree with all that Dr. Salerno had to say, but his argument in favor of a diet very low in carbs. does make sense to me.

Finally, I think that it is dangerous to extrapolate the results of any study, no matter how comprehensive, to the population in general. Each individual is unique in terms of his or her genetic makeup and life history; the latter also influences metabolic patterns. (Even identical twins raised together may display different metabolic patterns, because of their different life histories.)  So, while a low carb. diet may work well for a lot of people, it may have very negative effects on a few. Increases in inflammation markers and adverse effects on LDL cholesterol (especially when LDL is measured directly, accounting for particle numbers and sizes) are warning signs that any low carb. dieter should pay attention to.

Reference:

Miller, M. et al. (2009). Comparative effects of three popular diets on lipids, endothelial function, and c-reactive protein during weight maintenance. Journal of the American Dietetic Association, 109, 713-717.

Tuesday, December 22, 2009

What's the Ideal Fasting Insulin Level?

[2013 update.  I'm leaving this post up for informational purposes, but I think it's difficult to determine the "ideal" insulin level because it depends on a variety of factors including diet composition.  Also, insulin assays are not always comparable to one another, particularly the older assays, so it's difficult to compare between studies]

Insulin is an important hormone. Its canonical function is to signal cells to absorb glucose from the bloodstream, but it has many other effects. Chronically elevated insulin is a marker of metabolic dysfunction, and typically accompanies high fat mass, poor glucose tolerance (prediabetes) and blood lipid abnormalities. Measuring insulin first thing in the morning, before eating a meal, reflects fasting insulin. High fasting insulin is a marker of metabolic problems and may contribute to some of them as well.

Elevated fasting insulin is a hallmark of the metabolic syndrome, the quintessential modern metabolic disorder that affects 24% of Americans (NHANES III). The average insulin level in the U.S., according to the NHANES III survey, is 8.8 uIU/mL for men and 8.4 for women (2). Given the degree of metabolic dysfunction in this country, I think it's safe to say that the ideal level of fasting insulin is probably below 8.4 uIU/mL.

Let's dig deeper. What we really need is a healthy, non-industrial "negative control" group. Fortunately, Dr. Staffan Lindeberg and his team made detailed measurements of fasting insulin while they were visiting the isolated Melanesian island of Kitava (3). He compared his measurements to age-matched Swedish volunteers. In male and female Swedes, the average fasting insulin ranges from 4-11 uIU/mL, and increases with age. From age 60-74, the average insulin level is 7.3 uIU/mL.

In contrast, the range on Kitava is 3-6 uIU/mL, which does not increase with age. In the 60-74 age group, in both men and women, the average fasting insulin on Kitava is 3.5 uIU/mL. That's less than half the average level in Sweden and the U.S. Keep in mind that the Kitavans are lean and have an undetectable rate of heart attack and stroke.

Another example from the literature are the Shuar hunter-gatherers of the Amazon rainforest. Women in this group have an average fasting insulin concentration of 5.1 uIU/mL (4; no data was given for men).

I found a couple of studies from the early 1970s as well, indicating that African pygmies and San bushmen have rather high fasting insulin. Glucose tolerance was excellent in the pygmies and poor in the bushmen (5, 6, free full text). This may reflect differences in carbohydrate intake. San bushmen consume very little carbohydrate during certain seasons, and thus would likely have glucose intolerance during that period. There are three facts that make me doubt the insulin measurements in these older studies:
  1. It's hard to be sure that they didn't eat anything prior to the blood draw.
  2. From what I understand, insulin assays were variable and not standardized back then.
  3. In the San study, their fasting insulin was 1/3 lower than the Caucasian control group (10 vs. 15 uIU/mL). I doubt these active Caucasian researchers really had an average fasting insulin level of 15 uIU/mL. Both sets of measurements are probably too high.
Now you know the conflicting evidence, so you're free to be skeptical if you'd like.

We also have data from a controlled trial in healthy urban people eating a "paleolithic"-type diet. On a paleolithic diet designed to maintain body weight (calorie intake had to be increased substantially to prevent fat loss during the diet), fasting insulin dropped from an average of 7.2 to 2.9 uIU/mL in just 10 days. This is despite a substantial intake of carbohydrate, including fruit and vegetable sugars.  The variation in insulin level between individuals decreased 9-fold, and by the end, all participants were close to the average value of 2.9 uIU/mL. This shows that high fasting insulin is correctable in people who haven't yet been permanently damaged by the industrial diet and lifestyle. The study included men and women of European, African and Asian descent (7).

One final data point. My own fasting insulin, earlier this year, was 2.3 uIU/mL. I believe it reflects a good diet, regular exercise, sufficient sleep, and a relatively healthy diet growing up. It does not reflect: carbohydrate restriction, fat restriction, or saturated fat restriction.

So what's the ideal fasting insulin level? My current feeling is that we can consider anything between 2 and 6 uIU/mL within our evolutionary template.

Saturday, December 19, 2009

Total cholesterol and cardiovascular disease: A U-curve relationship

The hypothesis that blood cholesterol levels are positively correlated with heart disease (the lipid hypothesis) dates back to Rudolph Virchow in the mid-1800s.

One famous study that supported this hypothesis was Ancel Keys's Seven Countries Study, conducted between the 1950s and 1970s. This study eventually served as the foundation on which much of the advice that we receive today from doctors is based, even though several other studies have been published since that provide little support for the lipid hypothesis.

The graph below (source: canibaisereis.com, with many thanks to O Primitivo) shows the results of one study, involving many more countries than Key's Seven Countries Study, that actually suggests a NEGATIVE linear correlation between total cholesterol and cardiovascular disease.


Now, most relationships in nature are nonlinear, with quite a few following a pattern that looks like a U-curve (plain or inverted); sometimes called a J-curve pattern. The graph below (source also: canibaisereis.com) shows the U-curve relationship between total cholesterol and mortality, with cardiovascular disease mortality indicated through a dotted red line at the bottom.

This graph has been obtained through a nonlinear analysis, and I think it provides a better picture of the relationship between total cholesterol (TC) and mortality. Based on this graph, the best range of TC that one can be at is somewhere between 210, where cardiovascular disease mortality is minimized; and 220, where total mortality is minimized.

The total mortality curve is the one indicated through the full blue line at the top. In fact, it suggests that mortality increases sharply as TC decreases below 200.

Now, these graphs relate TC with disease and mortality, and say nothing about LDL cholesterol (LDL). In my own experience, and that of many people I know, a TC of about 200 will typically be associated with a slightly elevated LDL (e.g., 110 to 150), even if one has a high HDL cholesterol (i.e., greater than 60).

Yet, most people who have a LDL greater than 100 will be told by their doctors, usually with the best of the intentions, to take statins, so that they can "keep their LDL under control". (LDL levels are usually calculated, not measured directly, which itself creates a whole new set of problems.)

Alas, reducing LDL to 100 or less will typically reduce TC below 200. If we go by the graphs above, especially the one showing the U-curves, these folks' risk for cardiovascular disease and mortality will go up - exactly the opposite effect that they and their doctors expected. And that will cost them financially as well, as statin drugs are expensive, in part to pay for all those TV ads.

Monday, December 14, 2009

The Dirty Little Secret of the Diet-Heart Hypothesis

The diet-heart hypothesis is the idea that saturated fat, and in some versions cholesterol, raises blood cholesterol and contributes to the risk of having a heart attack. To test this hypothesis, scientists have been studying the relationship between saturated fat consumption and heart attack risk for more than half a century. What have these studies found?

The large majority of observational studies have found no connection between habitualsaturated fat consumption and heart attack risk. The scientific literature contains dozens of these studies, so let's narrow the field to prospective studies only, because they are considered the most reliable. In this study design, investigators find a group of initially healthy people, record information about them (in this case what they eat), and watch who gets sick over the years.

A Sampling of Unsupportive Studies

Here are references to ten high-impact prospective studies, spanning half a century, showing no association between saturated fat consumption and heart attack risk. Ignore the saturated-to-polyunsaturated ratios, Keys/Hegsted scores, etc. What we're concerned with is the straightforward question: do people who eat more saturated fat have more heart attacks? Many of these papers allow free access to the full text, so have a look for yourselves if you want:

A Longitudinal Study of Coronary Heart Disease. Circulation. 1963.

Diet and Heart: a Postscript. British Medical Journal. 1977. Saturated fat was unrelated to heart attack risk, but fiber was protective.

Dietary Intake and the Risk of Coronary Heart Disease in Japanese Men Living in Hawaii. American Journal of Clinical Nutrition. 1978.

Relationship of Dietary Intake to Subsequent Coronary Heart Disease Incidence: the Puerto Rico Heart Health Program. American Journal of Clinical Nutrition. 1980.

Diet, Serum Cholesterol, and Death From Coronary Heart Disease: The Western Electric Study. New England Journal of Medicine. 1981.

Diet and 20-year Mortality in Two Rural Population Groups of Middle-Aged Men in Italy. American Journal of Clinical Nutrition. 1989. Men who died of CHD ate significantly less saturated fat than men who didn't.

Diet and Incident Ischaemic Heart Disease: the Caerphilly Study. British Journal of Nutrition. 1993. They measured animal fat intake rather than saturated fat in this study.

Dietary Fat and Risk of Coronary Heart Disease in Men: Cohort Follow-up Study in the United States. British Medical Journal. 1996. This is the massive Physicians Health Study. Scroll down to table 2 and see for yourself that the association between saturated fat intake and heart attack risk disappears after adjustment for several factors including family history of heart attack, smoking and fiber intake. That's because, as in most modern studies, people who eat steak are also more likely to smoke, avoid vegetables, eat fast food, etc.

Dietary Fat Intake and the Risk of Coronary Heart Disease in Women. New England Journal of Medicine. 1997. From the massive Nurse's Health study. The abstract claims that saturated fat was associated with heart attack risk. However, the association disappeared when they adjusted for monounsaturated and polyunsaturated fat intake. Have a look at table 3.

Dietary Fat Intake and Early Mortality Patterns-- Data from the Malmo Diet and Cancer Study. Journal of Internal Medicine. 2005.

I just listed 10 prospective studies published in top peer-reviewed journals that found no association between saturated fat and heart disease risk. This is less than half of the prospective studies that have come to the same conclusion, representing by far the majority of studies to date. If saturated fat is a dominant cause of cardiovascular disease, why are its effects essentially undetectable in the best studies we can muster?

Studies that Support the Diet-Heart Hypothesis

To be complete, some studies have found an association between saturated fat consumption and heart attack risk. Here's a list of all four that I'm aware of, with comments:

Ten-year Incidence of Coronary Heart Disease in the Honolulu Heart Program: relationship to nutrient intake. American Journal of Epidemiology. 1984. "Men who developed coronary heart disease also had a higher mean intake of percentage of calories from protein, fat, saturated fatty acids, and polyunsaturated fatty acids than men who remained free of coronary heart disease." The difference in saturated fat intake between people who had heart attacks and those who didn't, although statistically significant, was very small.

Diet and 20-Year Mortality From Coronary Heart Disease: the Ireland-Boston Diet-Heart Study. New England Journal of Medicine. 1985. "Overall, these results tend to support the hypothesis that diet is related, albeit weakly, to the development of coronary heart disease."

Relationship Between Dietary Intake and Coronary Heart Disease Mortality: Lipid Research Clinics Prevalence Follow-up Study. Journal of Clinical Epidemiology. 1996. "...increasing percentages of energy intake as total fat (RR 1.04, 95% CI = 1.01 – 1.08), saturated fat (RR 1.11, CI = 1.04 – 1.18), and monounsaturated fat (RR 1.08, CI = 1.01 – 1.16) were significant risk factors for CHD mortality among 30 to 59 year olds... None of the dietary components were significantly associated with CHD mortality among those aged 60–79 years." Note that the associations were very small, also included monounsaturated fat (like in olive oil), and only applied to the age group with the lower risk of heart attack.

The Combination of High Fruit and Vegetable and Low Saturated Fat Intakes is More Protective Against Mortality in Aging Men than is Either Alone. Journal of Nutrition. 2005. Higher saturated fat intake was associated with a higher risk of heart attack; fiber was strongly protective.

The Review Papers

Over 25 high-quality studies conducted, and only 4 support the diet-heart hypothesis. In case you're concerned that I'm cherry-picking studies, here are links to review papers on the same data that have reached the same conclusion:

Meta-analysis of prospective cohort studies evaluating the association of saturated fat with cardiovascular disease.  American Journal of Clinical Nutrition. 2010.  "A meta-analysis of prospective epidemiologic studies showed that there is no significant evidence for concluding that dietary saturated fat is associated with an increased risk of CHD or CVD."

A Systematic Review of the Evidence Supporting a Causal Link Between Dietary Factors and Coronary Heart Disease. Archives of Internal Medicine. 2009. "Insufficient evidence (less than or equal to 2 criteria) of association is present for intake of supplementary vitamin E and ascorbic acid (vitamin C); saturated and polyunsaturated fatty acids; total fat; alpha-linolenic acid; meat; eggs; and milk" They analyzed prospective studies representing over 160,000 patients from 11 studies meeting their rigorous inclusion criteria, and found no association between saturated fat consumption and heart attack risk.

The Questionable Role of Saturated and Polyunsaturated Fatty Acids in Cardiovascular Disease. Journal of Clinical Epidemiology. 1998. Dr. Uffe Ravnskov challenges the diet-heart hypothesis simply by collecting all the relevant studies and summarizing their findings.

Where's the Disconnect?

The first part of the diet-heart hypothesis states that dietary saturated fat raises the cholesterol/LDL concentration of the blood. The second part states that increased blood cholesterol/LDL increases the risk of having a heart attack. What part of this is incorrect?

There's definitely an association between blood cholesterol/LDL level and heart attack risk in certain populations, including Americans. MRFIT, among other studies, showed this definitively, although the lowest risk of all-cause mortality was at an average level of cholesterol.

So we're left with the first premise: that saturated fat increases blood cholesterol/LDL. Could this hypothesis be less well supported than it appears?  The data that are used to support it come almost exclusively from short-term feeding studies (<3 and="" association="" between="" blood="" consumption="" effect="" fat="" found="" habitual="" have="" here="" how="" information="" is="" lipids.="" little="" long="" months="" most="" nbsp="" observational="" on="" p="" persists="" saturated="" studies="" surprisingly="" this="">

Tuesday, December 8, 2009

Refined carbs, sugar, and cholesterol: My own experience

A few years ago I went to the doctor for a routine appointment, and I was told that my LDL cholesterol was elevated. I was in my early 40s. My lipid profile was the following - LDL: 156, HDL: 38, triglycerides: 188. The LDL was calculated. I was weighing about 210 lbs, which was too high for my height (5 ft 8 in). My blood pressure was low, as it has always been - systolic: 109, diastolic: 68.

My doctor gave me the standard advice in these cases: exercise, lose weight, and, most importantly, reduce your intake of saturated fat. I was also told that I would probably have to take statins, as my high LDL likely had something to do with my genetic makeup. Again, this is quite standard, and we see it all over the place, particularly in commercials for statins.

I told my doctor that I would do some research on the topic, which I am going to save for other posts. Let me get to the point, by telling you what my lipid profile is today - LDL: 123, HDL: 66, triglycerides: 46. Again, the LDL value is calculated. I am weighing about 152 lbs now, with about 13 percent of body fat.

The HDL and triglycerides numbers above are shown in bold font because my research convinced me that these two numbers are the ones most people should really worry about when trying to address what is known as dyslipidemia. Here I am assuming that only standard lipid profiles are available; there are better alternatives, such as particle type analyses, which are not yet standard.

Many people who suffer from cardiovascular disease have low LDL cholesterol, but very few of those have high HDL cholesterol, which is one of the best predictors of cardiovascular disease among lipids. More specifically, if you have an HDL higher than 60, you have a very small chance of developing cardiovascular disease. (It can happen, but it is very unlikely, with a percentage chance in the single digits.)

Interestingly, low HDL cholesterol is also associated with the metabolic syndrome. This syndrome is characterized by the following:

- High fasting serum glucose (hyperglycemia), which is one of many signs of insulin resistance, a precursor to diabetes type 2;
- High blood pressure;
- Abdominal obesity (also known as pot or beer belly);
- Low HDL cholesterol; and
- Elevated triglycerides.

Now, you may ask, how did you increase your HDL? Well, I tried a number of things - diet and lifestyle changes - and had a blood test every 3 months. After a while I was able to put all of the measures in a spreadsheet table, and correlate them using a statistical software that I developed, to give me an idea of what was going on.

Weight was a big factor on LDL, and I was able to bring my weight down to 150 lbs and my LDL to below 100 at some point. For me, and many other people, body weight and LDL cholesterol are strongly and positively correlated (the higher the weight, the higher the LDL cholesterol - actually body fat seems to be the real culprit). Moreover, my LDL seemed to decrease more markedly when my weight was on the way down, and not as much when it was stable, even if low.

But the HDL would only increase if I increased my saturated fat intake. The problem is that every time I increased my saturated fat intake my LDL would go up; it reached 162 at one point, when my HDL went up to a modest but encouraging 47. That was my highest HDL until I eliminated refined carbs and sugars (e.g., bread, pasta, cereals, doughnuts, bagels, regular sodas) from my diet.

When I brought my intake of refined carbs and sugars down to zero, my intake of protein and saturated fat went up. Either that would happen, or I would starve, because you have to eat something. (I figured that I would not die by doing a low carb/high fat-protein experiment for 3 months to see what happened.) Also, I dramatically increased my dietary cholesterol - two to four eggs per day, organ meats, and seafood.

That is when my HDL shot up, to 66, and my LDL went down. Yes, my LDL levels seem to be negatively correlated with dietary saturated fat and cholesterol amounts, as long as I do not consume refined carbs and sugars. Moreover, it is very likely that my LDL particle size increased, and large LDL particles DO NOT cause atherosclerosis because they cannot penetrate the artery walls.

So, the bottom line is that, at least for me, an INCREASE in saturated fat and a DECREASE in refined carbs and sugars, happening together, seem to have taken me out of my previous path toward the metabolic syndrome.

Moreover, I feel a lot more energetic than before, my immune system seems to have gotten better at fighting disease, and even my pollen allergies are not as bad as they were before. Admittedly, these benefits may be strongly associated with the weight loss and the related reduction in body fat percentage.

I hope this post is helpful to others. The standard advice that people with high LDL cholesterol receive, which usually focuses on reducing saturated fat intake, has a big problem. When you reduce your intake of a type of food, you usually increase your intake of other types of food. Most people who try to reduce their saturated fat intake invariably increase their carb intake, usually with the wrong types of carb-rich foods (the man-made ones), simply because they go hungry.

Monday, December 7, 2009

Butyric Acid: an Ancient Controller of Metabolism, Inflammation and Stress Resistance?

An Interesting Finding

Susceptible strains of rodents fed high-fat diets overeat, gain fat and become profoundly insulin resistant. Dr. Jianping Ye's group recently published a paper showing that the harmful metabolic effects of a high-fat diet (lard and soybean oil) on mice can be prevented, and even reversed, using a short-chain saturated fatty acid called butyric acid (hereafter, butyrate). Here's a graph of the percent body fat over time of the two groups:

The butyrate-fed mice remained lean and avoided metabolic problems. Butyrate increased their energy expenditure by increasing body heat production and modestly increasing physical activity. It also massively increased the function of their mitochondria, the tiny power plants of the cell.

Butyrate lowered their blood cholesterol by approximately 25 percent, and their triglycerides by nearly 50 percent. It lowered their fasting insulin by nearly 50 percent, and increased their insulin sensitivity by nearly 300 percent*. The investigators concluded:
Butyrate and its derivatives may have potential application in the prevention and treatment of metabolic syndrome in humans.
There's one caveat, however: the butyrate group at less food. Something about the butyrate treatment caused their food intake to decline after 3 weeks, dropping roughly 20% by 10 weeks. The investigators cleverly tried to hide this by normalizing food intake to body weight, making it look like the food intake of the comparison group was dropping as well (when actually it was staying the same as this group was gaining weight).  This does cast some doubt on the health-promoting effects of high-dose butyrate.

I found this study thought-provoking, so I looked into butyrate further.

Butyrate Suppresses Inflammation in the Gut and Other Tissues

In most animals, the highest concentration of butyrate is found in the gut. That's because it's produced by intestinal bacteria from carbohydrate that the host cannot digest, such as cellulose and pectin. Indigestible carbohydrate is the main form of dietary fiber.

It turns out, butyrate has been around in the mammalian gut for so long that the lining of our large intestine has evolved to use it as its primary source of energy. It does more than just feed the bowel, however. It also has potent anti-inflammatory and anti-cancer effects. So much so, that investigators are using oral butyrate supplements and butyrate enemas to treat inflammatory bowel diseases such as Crohn's and ulcerative colitis. Some investigators are also suggesting that inflammatory bowel disorders may be caused or exacerbated by a deficiency of butyrate in the first place.

Butyrate, and other short-chain fatty acids produced by gut bacteria**, has a remarkable effect on intestinal permeability. In tissue culture and live rats, short-chain fatty acids cause a large and rapid decrease in intestinal permeability. Butyrate, or dietary fiber, prevents the loss of intestinal premeability in rat models of ulcerative colitis. This shows that short-chain fatty acids, including butyrate, play an important role in the maintenance of gut barrier integrity. Impaired gut barrier integrity is associated with many diseases, including fatty liver, heart failure and autoimmune diseases (thanks to Pedro Bastos for this information-- I'll be covering the topic in more detail later).

Butyrate's role doesn't end in the gut. It's absorbed into the circulation, and may exert effects on the rest of the body as well. In human blood immune cells, butyrate is potently anti-inflammatory***.

Butyrate Increases Resistance to Metabolic and Physical Stress

Certain types of fiber reduce atherosclerosis in animal models, and this effect may be due to butyrate production produced when the fiber is fermented. Fiber intake was associated with lower blood markers of inflammation in the Women's Health Initiative study, and has been repeatedly associated with lower heart attack risk and reduced progression of atherosclerosis in humans. Butyrate also sharply reduces the harmful effects of type 1 diabetes in rats, as does dietary fiber to a lesser extent.

Butyrate increases the function and survival of mice with certain neurodegenerative diseases. Polyglutamine diseases, which are the most common class of genetic neurodegenerative diseases, are delayed in mice treated with butyrate (1, 2, 3). Many of you have probably heard of Huntington's disease, which is the most common of the class. I did my thesis on a polyglutamine disease called SCA7, and this is the first suggestion I've seen that diet may be able to modify its course.

Yet another interesting finding in the first paper I discussed: mice treated with butyrate were more cold-resistant than the comparison group. When they were both placed in a cold room, body temperature dropped quite a bit in the comparison group, while it remained relatively stable in the butyrate group, despite the fact that the butyrate group was leaner****. This was due to increased heat production in the butyrate group.

Due to the potent effect butyrate has on a number of bodily processes, it may be a fundamental controller of metabolism, stress resistance and the immune system in mammals.

An Ancient Line of Communication Between Symbiotic Organisms

Why does butyrate have so much control over inflammation? Let's think about where it comes from. Bacteria in the gut produce it. It's a source of energy, so our bodies take it up readily. It's one of the main molecules that passes from the symbiotic (helpful) bacteria in the gut to the rest of the body. Could it be that the body receives butyrate as a signal that there's a thriving colony of symbiotic bacteria in the gut, inducing immune tolerance to them? The body may alter its immune response (inflammation) in order to permit a mutually beneficial relationship between itself and its symbionts.

Sources of Butyrate

There are two main ways to get butyrate and other short-chain fatty acids. The first is to eat fiber and let your intestinal bacteria do the rest. Whole plant foods such as sweet potatoes, properly prepared whole grains, beans, vegetables, fruit and nuts are good sources of fiber. Refined foods such as white flour, white rice and sugar are very low in fiber. Clinical trials have shown that increasing dietary fiber increases butyrate production, and decreasing fiber decreases it (free full text).

Butyrate also occurs in significant amounts in food. What foods contain butyrate? Hmm, I wonder where the name BUTYR-ate came from? Butter perhaps? Butter is 3-4 percent butyrate, the richest known source. But everyone knows butter is bad for you, right?

After thinking about it, I've decided that butyrate may have been a principal component of Dr. Weston Price's legendary butter oil. Price used this oil in conjunction with high-vitamin cod liver oil to heal tooth decay and a number of other ailments in his patients. The method he used to produce it would have concentrated fats with a low melting temperature, including butyrate, in addition to vitamin K2*****. Thus, the combination of high-vitamin cod liver oil and butter oil would have provided a potent cocktail of fat-soluble vitamins (A, D3, K2), omega-3 fatty acids and butyrate. It's no wonder it was so effective in his patients.


* According to insulin tolerance test.

** Acetate (acetic acid, the main acid in vinegar), propionate and butyrate are the primary three fatty acids produced by intestinal fermentation.

*** The lowest concentration used in this study, 30 micromolar, is probably higher than the concentration in peripheral serum under normal circumstances. Human serum butyrate is in the range of 4 micromolar in British adults, and 29 micromolar in the hepatic portal vein which brings fats from the digestive tract to the liver (ref). This would likely be at least two-fold higher in populations eating high-fiber diets.

**** Due to higher mitochondrial density in brown fat and more mitochondrial uncoupling.

***** Slow crystallization, which selectively concentrates triglycerides with a low melting point.

Wednesday, December 2, 2009

Malocclusion: Disease of Civilization, Part IX

A Summary

For those who didn't want to wade through the entire nerd safari, I offer a simple summary.

Our ancestors had straight teeth, and their wisdom teeth came in without any problem. The same continues to be true of a few non-industrial cultures today, but it's becoming rare. Wild animals also rarely suffer from orthodontic problems.

Today, the majority of people in the US and other affluent nations have some type of malocclusion, whether it's crooked teeth, overbite, open bite or a number of other possibilities.

There are three main factors that I believe contribute to malocclusion in modern societies:
  1. Maternal nutrition during the first trimester of pregnancy. Vitamin K2, found in organs, pastured dairy and eggs, is particularly important. We may also make small amounts from the K1 found in green vegetables.
  2. Sucking habits from birth to age four. Breast feeding protects against malocclusion. Bottle feeding, pacifiers and finger sucking probably increase the risk of malocclusion. Cup feeding and orthodontic pacifiers are probably acceptable alternatives.
  3. Food toughness. The jaws probably require stress from tough food to develop correctly. This can contribute to the widening of the dental arch until roughly age 17. Beef jerky, raw vegetables, raw fruit, tough cuts of meat and nuts are all good ways to exercise the jaws.
And now, an example from the dental literature to motivate you. In 1976, Dr. H. L. Eirew published an interesting paper in the British Dental Journal. He took two 12-year old identical twins, with identical class I malocclusions (crowded incisors), and gave them two different orthodontic treatments. Here's a picture of both girls before the treatment:


In one, he made more space in her jaws by extracting teeth. In the other, he put in an apparatus that broadened her dental arch, which roughly mimics the natural process of arch growth during childhood and adolescence. This had profound effects on the girls' subsequent occlusion and facial structure:

The girl on the left had teeth extracted, while the girl on the right had her arch broadened. Under ideal circumstances, this is what should happen naturally during development. Notice any differences?

Thanks to the Weston A Price foundation's recent newsletter for the study reference.